Open Access
Fig. 6
Download original image
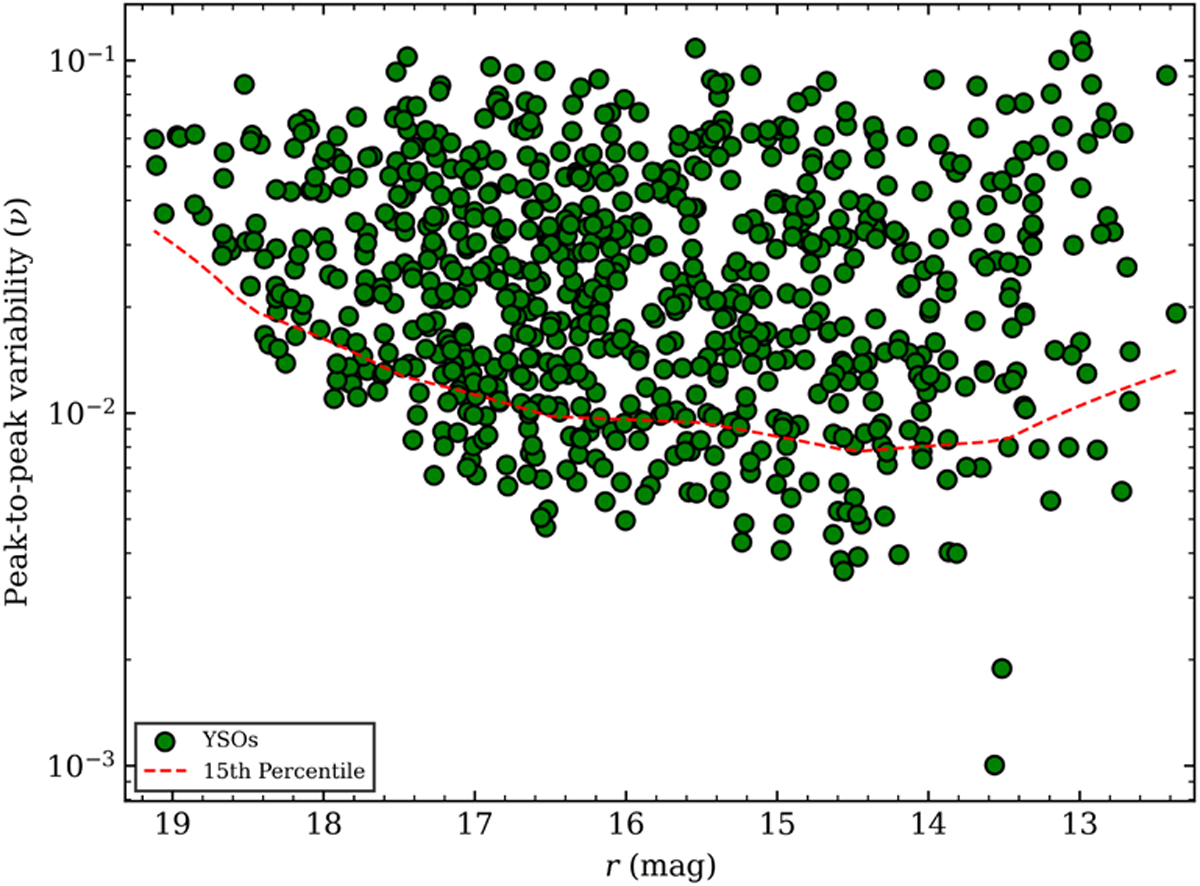
Normalized peak-to-peak variability metric, ν, vs. the mean r magnitude for our sample. The dashed line marks the 15th percentile of ν, and the objects in green above it are considered variables.
Current usage metrics show cumulative count of Article Views (full-text article views including HTML views, PDF and ePub downloads, according to the available data) and Abstracts Views on Vision4Press platform.
Data correspond to usage on the plateform after 2015. The current usage metrics is available 48-96 hours after online publication and is updated daily on week days.
Initial download of the metrics may take a while.