Fig. 3
Download original image
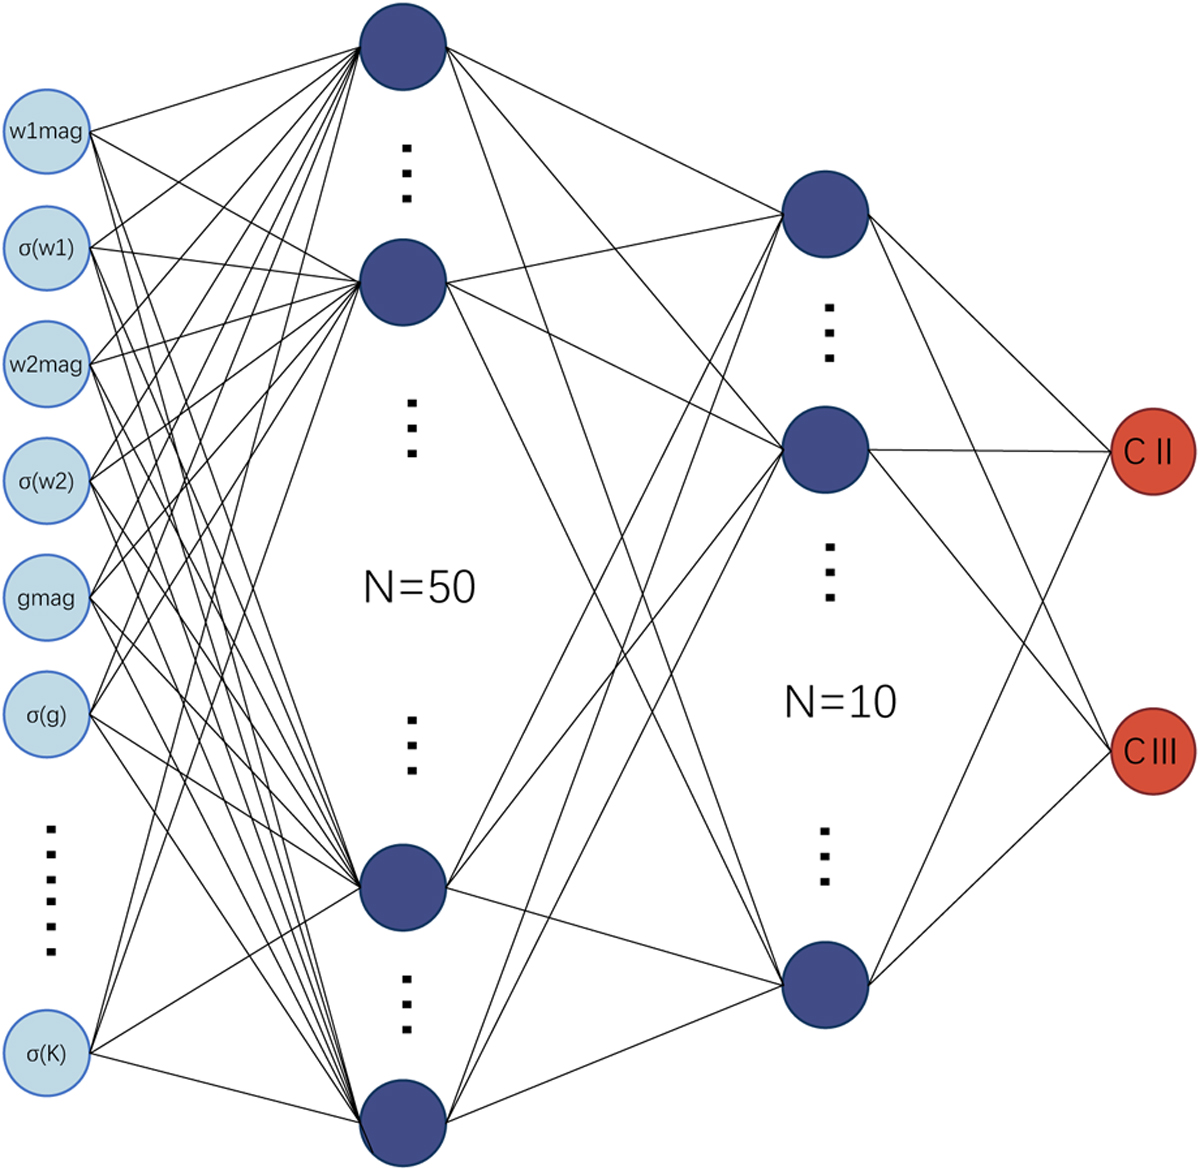
ANN model used for YSO classification. Light blue dots represent input nodes for each required feature. Dark blue dots denote hidden neurons with sigmoid activation, while red dots represent output neurons with probabilistic Softmax activation. Black lines illustrate the connecting weights. Not all hidden neurons and weights are shown, for readability purposes. CII denotes a source classified as Class II and CIII a source classified as Class III. σ denotes the errors in different bands.
Current usage metrics show cumulative count of Article Views (full-text article views including HTML views, PDF and ePub downloads, according to the available data) and Abstracts Views on Vision4Press platform.
Data correspond to usage on the plateform after 2015. The current usage metrics is available 48-96 hours after online publication and is updated daily on week days.
Initial download of the metrics may take a while.