Fig. 11
Download original image
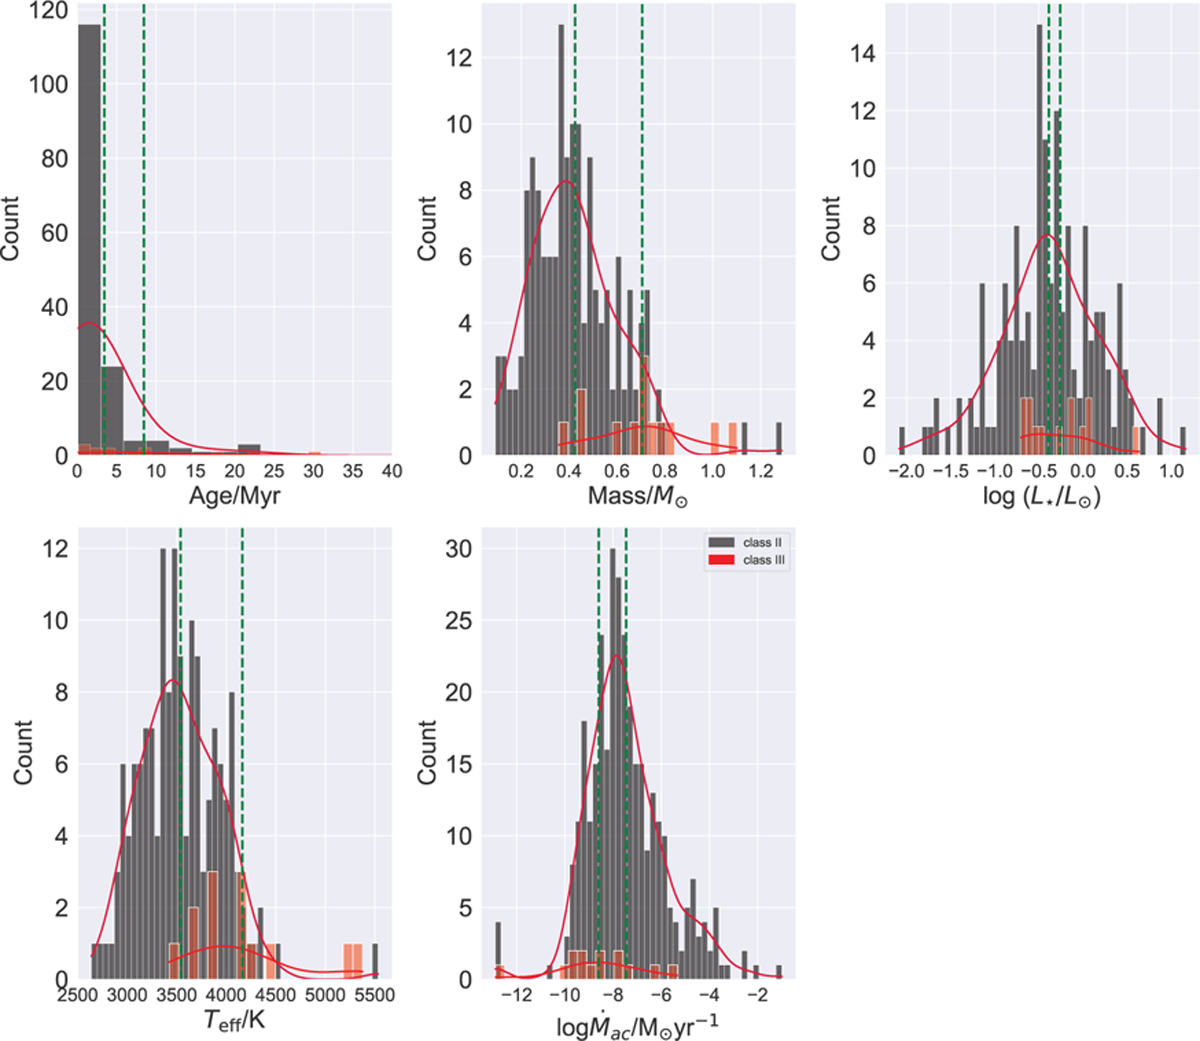
Histograms of physical parameters for Class II and III YSOs. The x-axis shows the physical parameters. The y-axis shows the number of YSOs for a certain physical parameter. Histogram distributions of Class II and Class III YSOs are indicated in black and red, respectively. The dashed green line represents the average value line, and the solid red line represents the fitted kernel density estimation line.
Current usage metrics show cumulative count of Article Views (full-text article views including HTML views, PDF and ePub downloads, according to the available data) and Abstracts Views on Vision4Press platform.
Data correspond to usage on the plateform after 2015. The current usage metrics is available 48-96 hours after online publication and is updated daily on week days.
Initial download of the metrics may take a while.