Fig. B.1.
Download original image
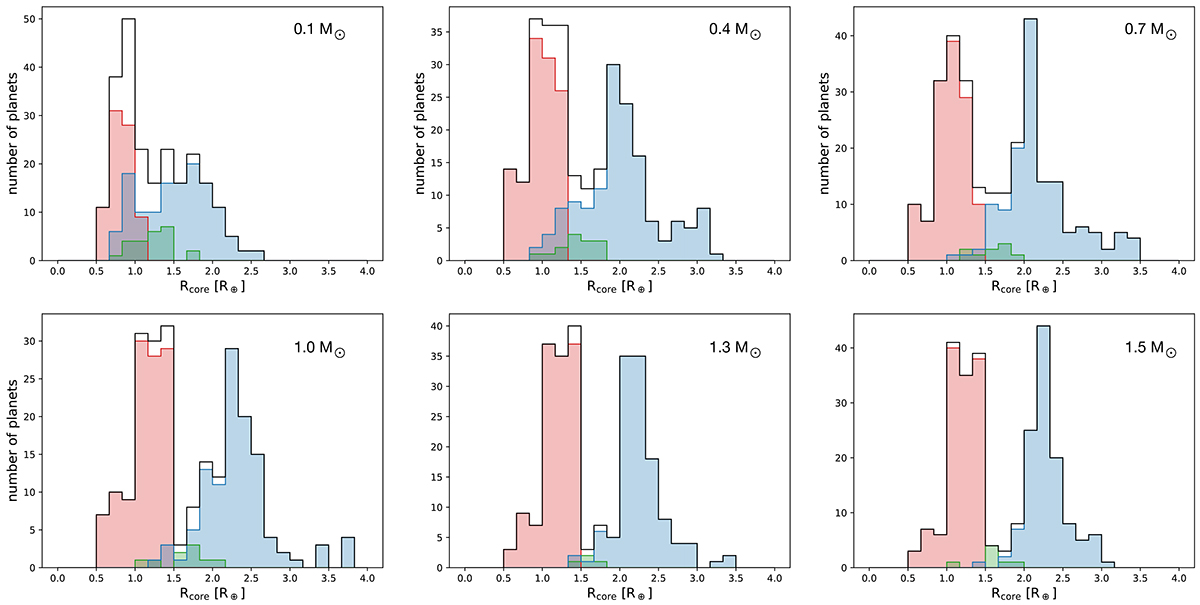
Histograms of core sizes at the end of formation, for the different stellar masses, and for planets with final orbital period below 100 days. Red bars indicate fH2O, core < 5%, green bars 5%≤fH2O, core < 45%, and blue bars fH2O, core ≥ 45%, where fH2O, core is the core water mass fraction at the end of formation. The black lines show the overall core size distribution.
Current usage metrics show cumulative count of Article Views (full-text article views including HTML views, PDF and ePub downloads, according to the available data) and Abstracts Views on Vision4Press platform.
Data correspond to usage on the plateform after 2015. The current usage metrics is available 48-96 hours after online publication and is updated daily on week days.
Initial download of the metrics may take a while.