Fig. 2.
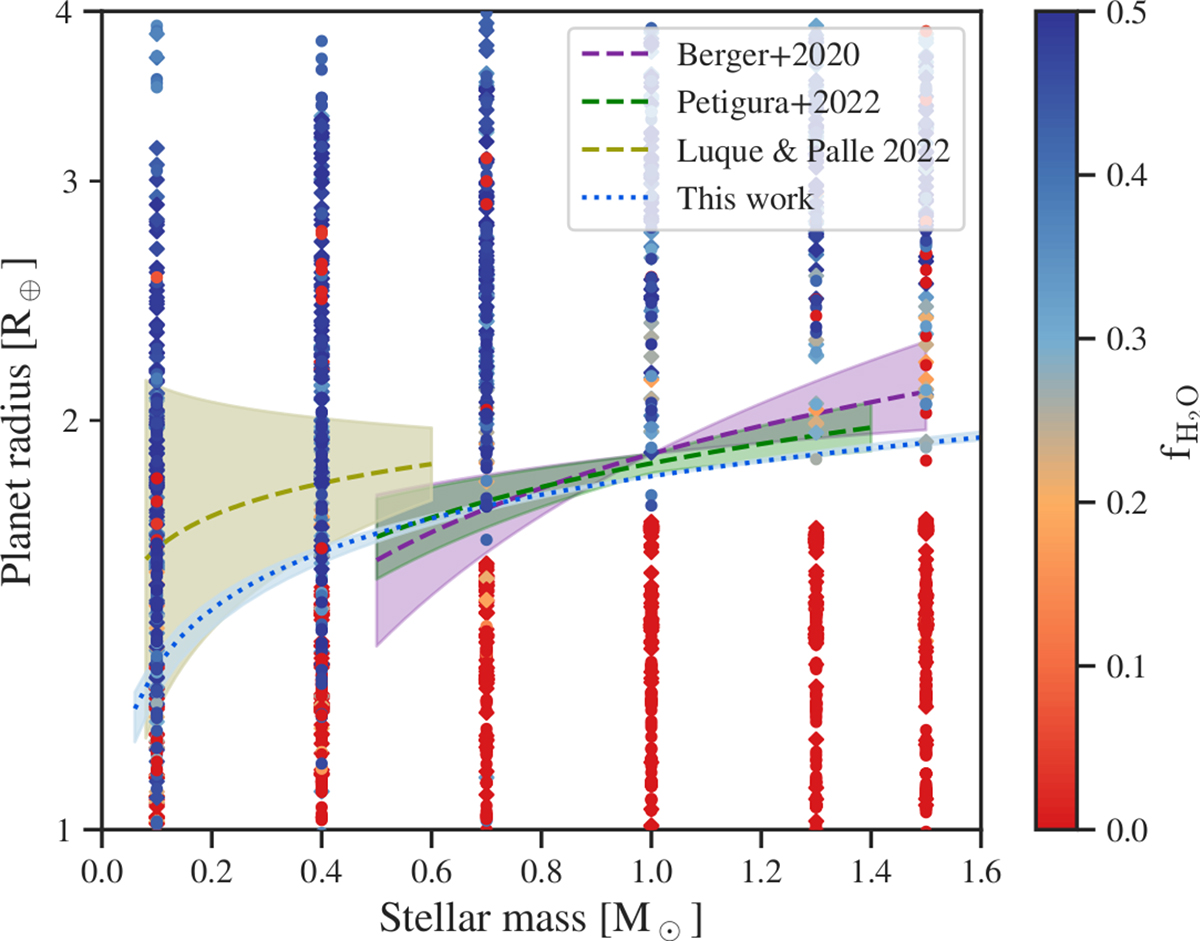
Download original image
Radius valley fit as a function of the stellar mass (blue line with errors in light-blue) for all our synthetic planets (colour-coded as a function of the water mass fraction). Dots correspond to the nominal output, diamonds to collisions. The green dashed line with the light-green shaded area show the best fit found by Petigura et al. (2022), the violet dashed line and the lilac shaded area represent the results found by Berger et al. (2020), and the mustard dashed line and the light-mustard shaded area represents the best fit by Luque & Pallé (2022). Our best fit was found using https://github.com/parkus/gapfit (Loyd et al. 2020).
Current usage metrics show cumulative count of Article Views (full-text article views including HTML views, PDF and ePub downloads, according to the available data) and Abstracts Views on Vision4Press platform.
Data correspond to usage on the plateform after 2015. The current usage metrics is available 48-96 hours after online publication and is updated daily on week days.
Initial download of the metrics may take a while.