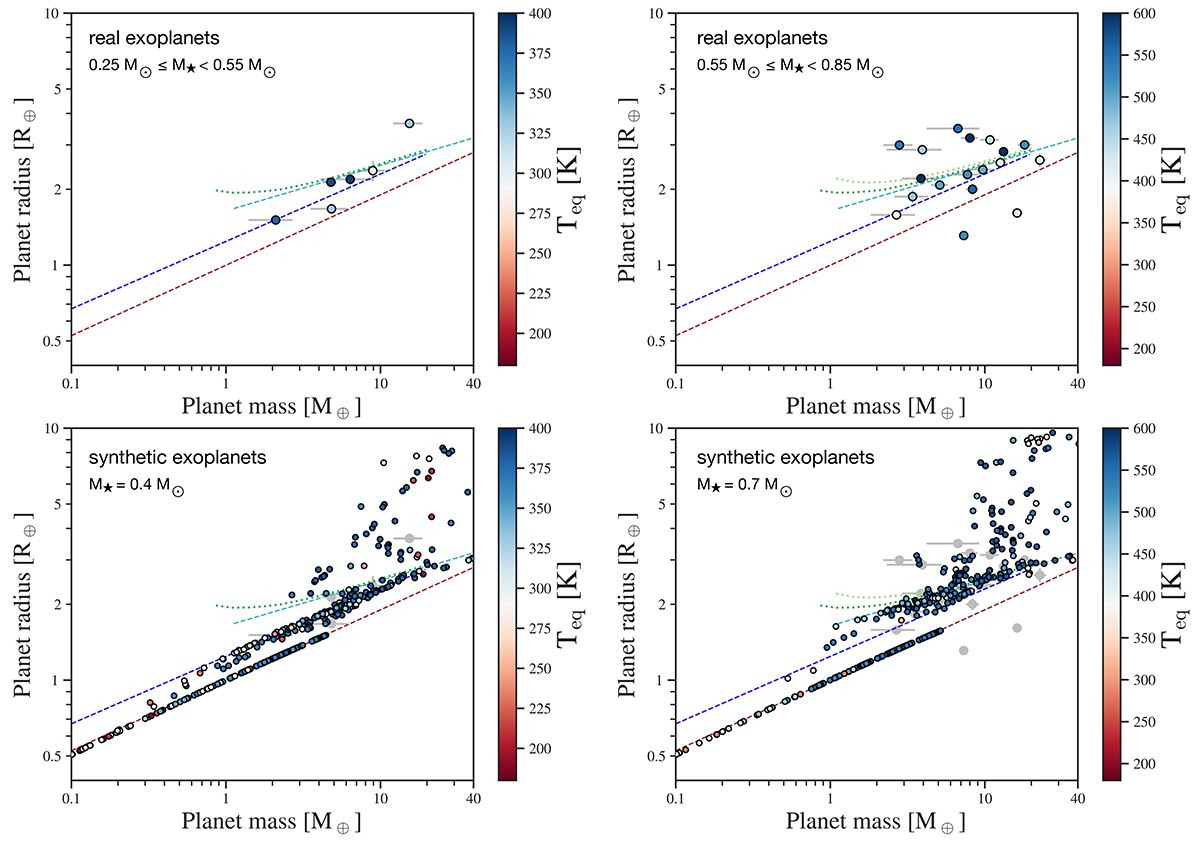
Fig. C.4.
Download original image
Comparison of real exoplanets for M⋆ = 0.4 M⊙ (left panels) and M⋆ = 0.7 M⊙ (right panels). The limit in equilibrium temperature is for proper comparison with our simulations. The brown- and blue-dashed lines correspond to Earth-like and 50% water+50% Earth-like compositions, with dark-blue indicating condensed-water and light-blue, steam-worlds (as defined in Appendix B.5). The green-dotted curves correspond to 50% steam+50% Earth-like from Aguichine et al. (2021) (Teq = 400 K for dark-green and Teq = 600 K for light-green). The real exoplanets are those with a relative error in radius less than 25% and in mass of less than 70%, with the data taken form the NASA Exoplanet Archive on 08.09.23. For the bottom panels, the real exoplanets are shown in the background in grey.
Current usage metrics show cumulative count of Article Views (full-text article views including HTML views, PDF and ePub downloads, according to the available data) and Abstracts Views on Vision4Press platform.
Data correspond to usage on the plateform after 2015. The current usage metrics is available 48-96 hours after online publication and is updated daily on week days.
Initial download of the metrics may take a while.