Open Access
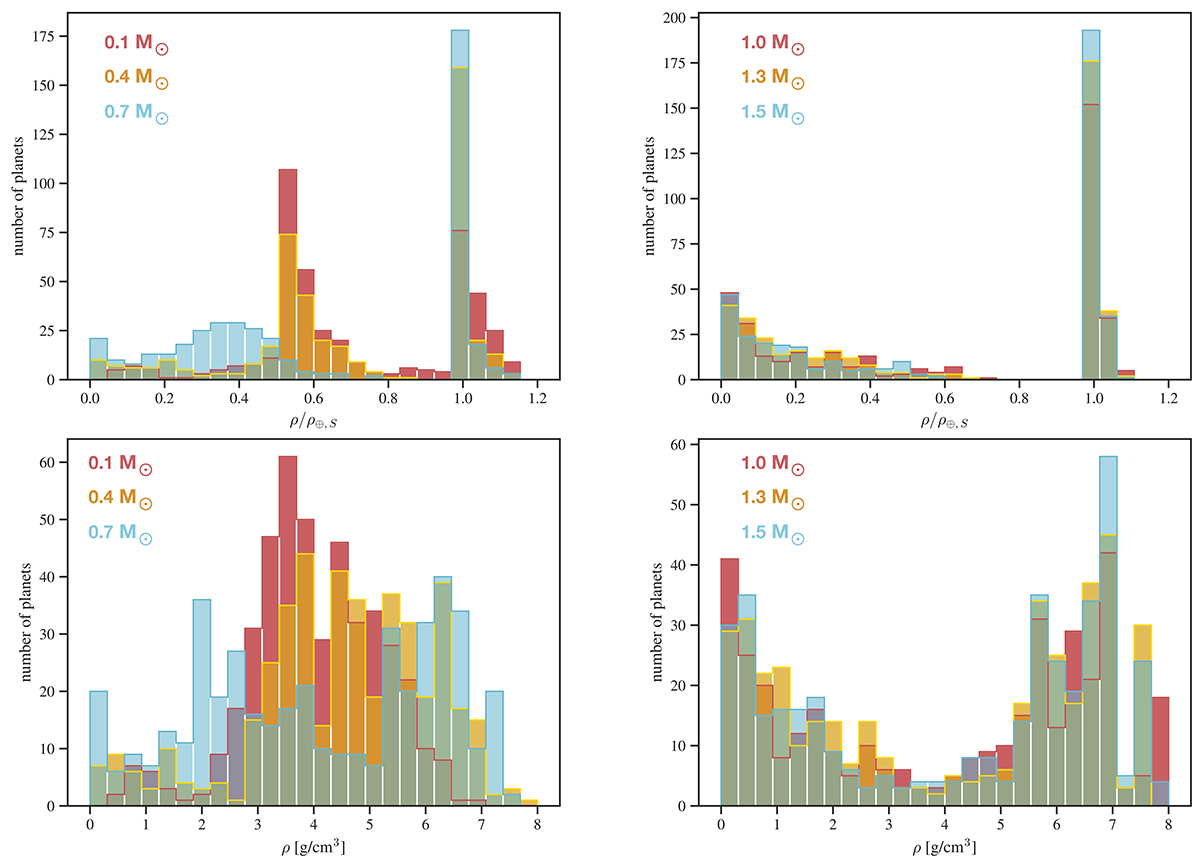
Fig. B.6.
Download original image
Planetary mean density for the different stellar masses. Left (right) panels show values for the low- (high-)mass stars, with the each colour corresponding to one stellar mass as indicated in the legend. The top panels show the normalised density (see text), while the bottom panels show the density in cgs.
Current usage metrics show cumulative count of Article Views (full-text article views including HTML views, PDF and ePub downloads, according to the available data) and Abstracts Views on Vision4Press platform.
Data correspond to usage on the plateform after 2015. The current usage metrics is available 48-96 hours after online publication and is updated daily on week days.
Initial download of the metrics may take a while.