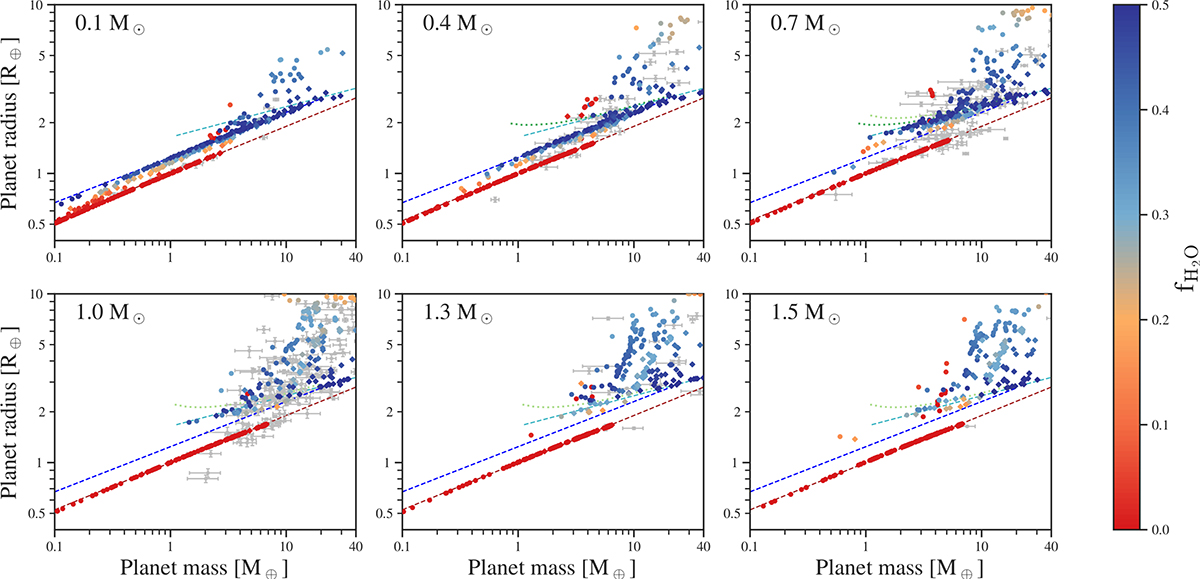
Fig. 1.
Download original image
MR diagram for different stellar masses. The colour bar represents the total water mass fraction in the planets. Dots correspond to the nominal output, diamonds to collisions. The brown- and blue-dashed lines correspond to a theoretical composition of Earth-like and 50% water + 50% Earth-like, as defined in Appendix B.5, with dark-blue indicating condensed-water worlds and light-blue indicating steam worlds. The green-dotted curves correspond to 50% steam + 50% Earth-like from Aguichine et al. (2021) (Teq = 400 K for dark-green and Teq = 600 K for light-green). Grey dots are real exoplanets with mass and radius measurements better than 75 and 20%, respectively (data taken from the NASA Exoplanet Archive on 08.09.23). The real exoplanets in each panel correspond to the stellar masses of 0–0.25 M⊙ for M⋆ = 0.1 M⊙, 0.25–0.55 M⊙ for M⋆ = 0.4 M⊙, 0.55–0.85 M⊙ for M⋆ = 0.7 M⊙, 0.85–1.15 M⊙ for M⋆ = 1.0 M⊙, 1.15–1.4 M⊙ for M⋆ = 1.3 M⊙, and 1.4–1.7 M⊙ for M⋆ = 1.5 M⊙.
Current usage metrics show cumulative count of Article Views (full-text article views including HTML views, PDF and ePub downloads, according to the available data) and Abstracts Views on Vision4Press platform.
Data correspond to usage on the plateform after 2015. The current usage metrics is available 48-96 hours after online publication and is updated daily on week days.
Initial download of the metrics may take a while.