Open Access
Fig. 7
Download original image
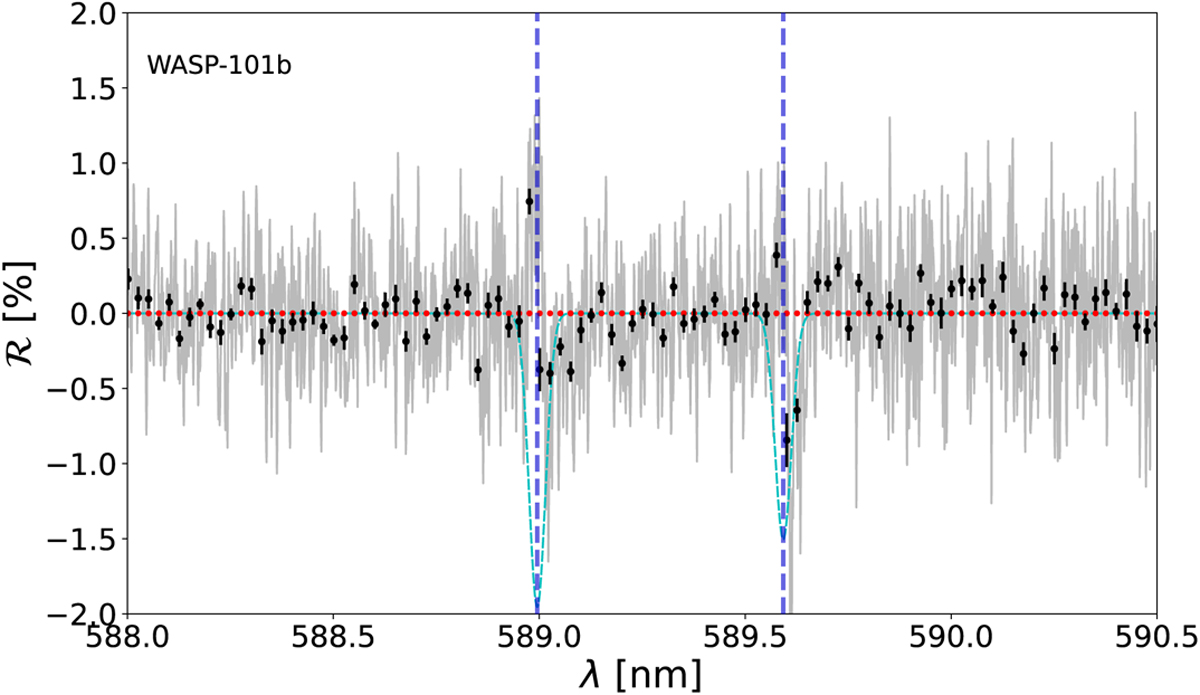
Transmission spectrum for WASP-101b showing a non-detection of any absorbers. The blue dashed lines indicate the position of the Na D2 and D1 lines. We show in cyan a simulated spectrum corresponding to a clear atmosphere model. In red we show a featureless spectrum. The latter model is preferred by a χ2 test.
Current usage metrics show cumulative count of Article Views (full-text article views including HTML views, PDF and ePub downloads, according to the available data) and Abstracts Views on Vision4Press platform.
Data correspond to usage on the plateform after 2015. The current usage metrics is available 48-96 hours after online publication and is updated daily on week days.
Initial download of the metrics may take a while.