Fig. 1
Download original image
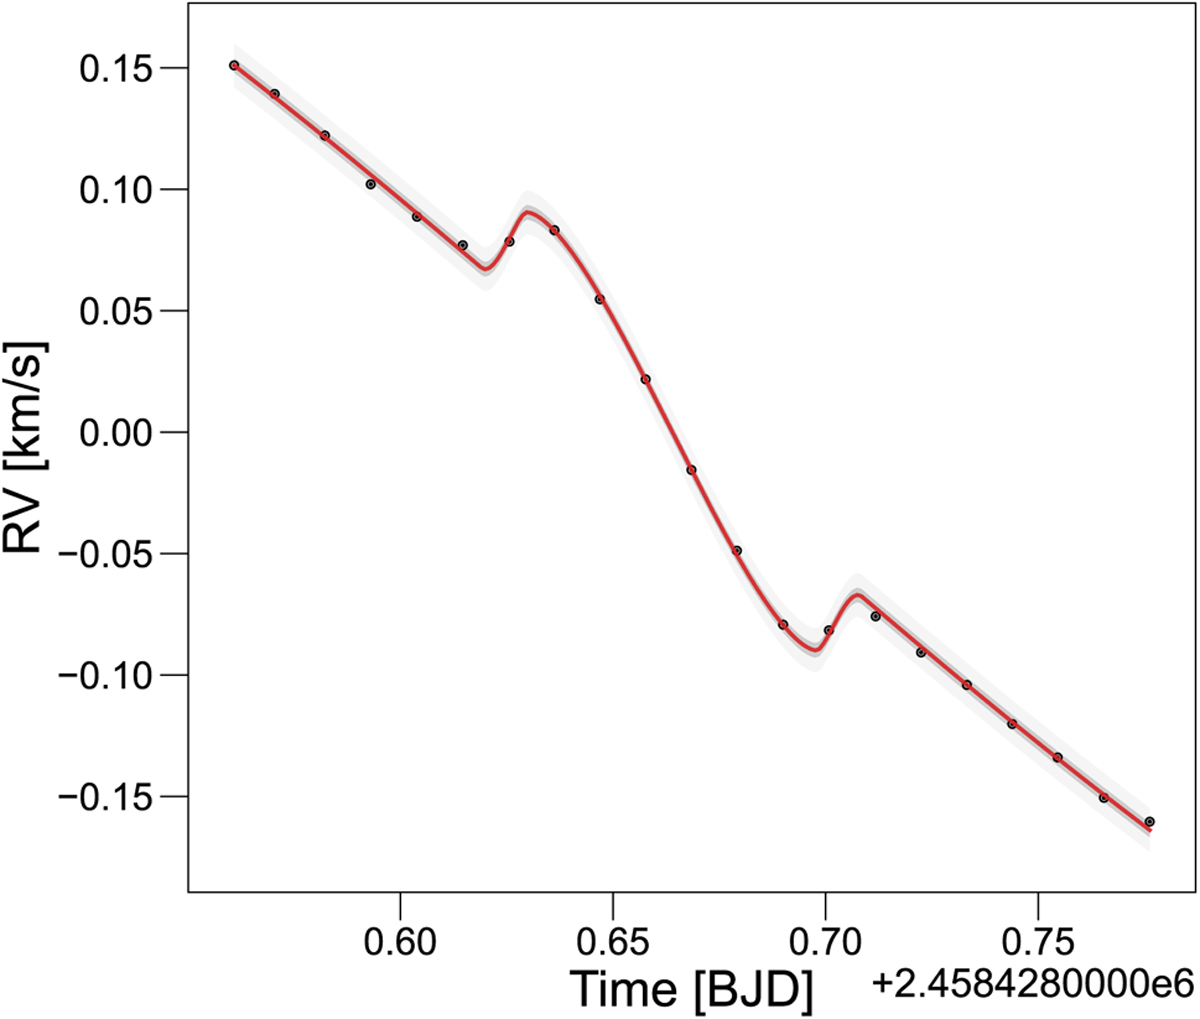
Rossiter-Mclaughlin effect of WASP-77 Ab observed with HARPS. The observed data points (black) are shown with their error bars, which in this case are smaller than the symbol size. The systemic velocity was removed for better visibility. The red line shows the model that fits the data best, together with 1σ (dark gray) and 3σ (light gray) confidence intervals.
Current usage metrics show cumulative count of Article Views (full-text article views including HTML views, PDF and ePub downloads, according to the available data) and Abstracts Views on Vision4Press platform.
Data correspond to usage on the plateform after 2015. The current usage metrics is available 48-96 hours after online publication and is updated daily on week days.
Initial download of the metrics may take a while.