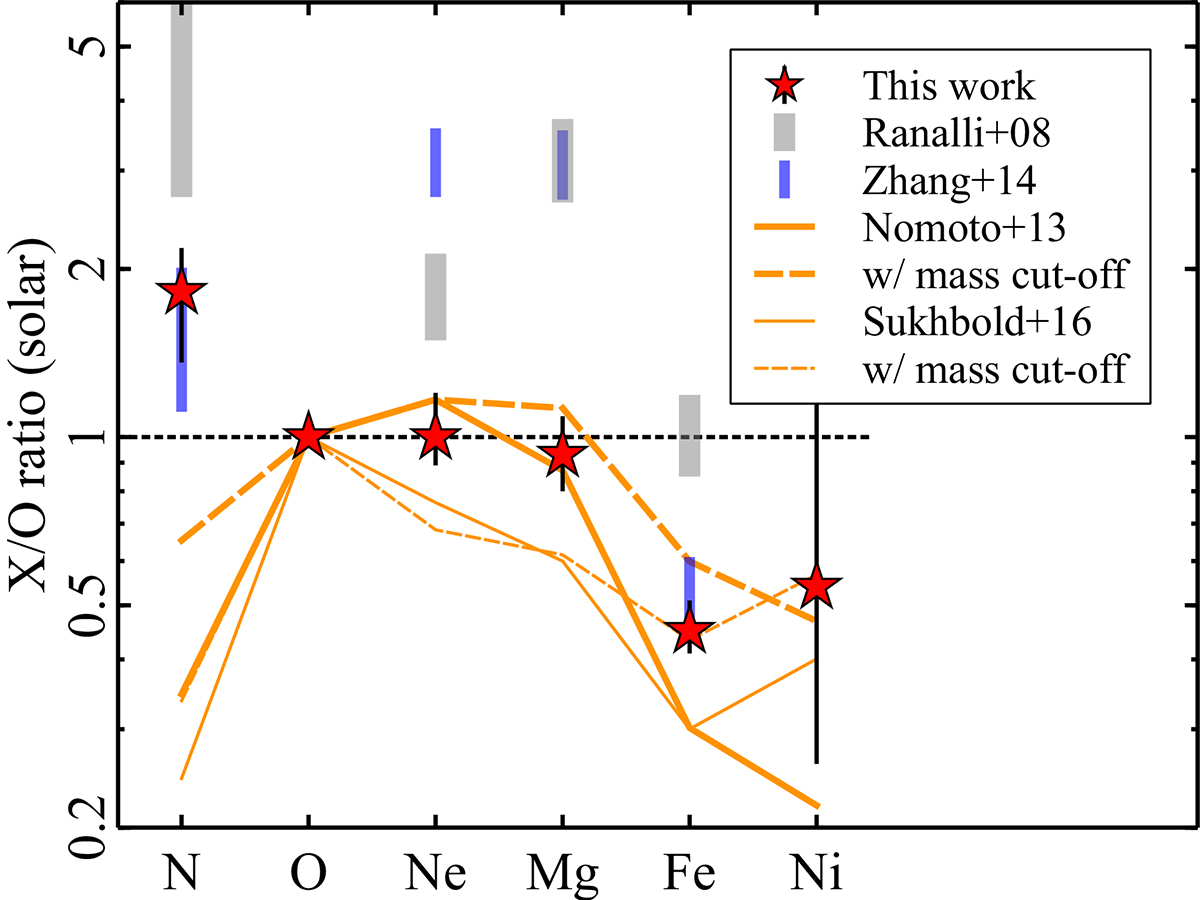
Fig. 6.
Download original image
Observed X/O abundance pattern from the broad-band spectral fits, where the medians and 16–84th percentile ranges for all dispersion angles are plotted. Two literature values from previous RGS works are given for comparison. The dashed line represents the solar composition. The solid thick and thin lines indicate the IMF-weighted yields predicted by Nomoto et al. (2013) and Sukhbold et al. (2016), respectively, assuming initially solar metallicity for the progenitors. The dashed lines are for each option of the mass-cutoff integration (< 25 M⊙).
Current usage metrics show cumulative count of Article Views (full-text article views including HTML views, PDF and ePub downloads, according to the available data) and Abstracts Views on Vision4Press platform.
Data correspond to usage on the plateform after 2015. The current usage metrics is available 48-96 hours after online publication and is updated daily on week days.
Initial download of the metrics may take a while.