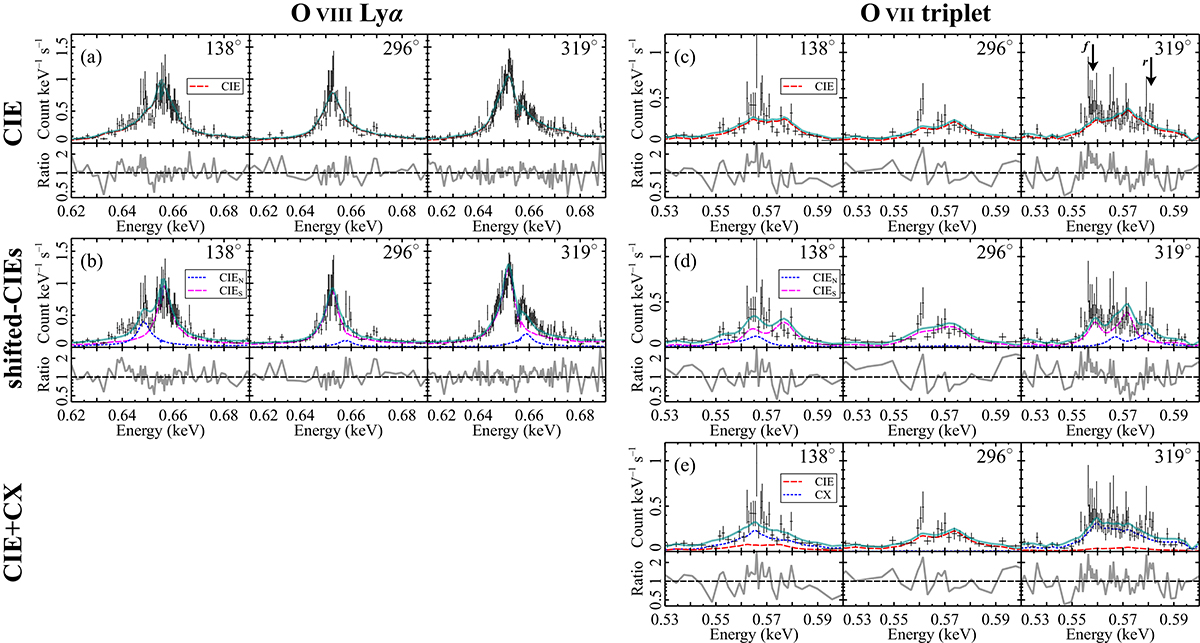
Fig. 2.
Download original image
RGS spectra of the centre of M 82 in the O VIII (a), (b) and O VII (c)–(e) bands for the three representative position angles. The best-fitting models and the data-to-model ratios for the three methods are plotted: the CIE modelling convolved with local band images (the first row), the shifted-CIEs modelling convolved by the broadband image (the second row), and the CIE+CX modelling convolved with the O VII band image (the third row, only for the O VII lines). The positions of the O VII forbidden and resonance lines are labelled in the 319° panel of c.
Current usage metrics show cumulative count of Article Views (full-text article views including HTML views, PDF and ePub downloads, according to the available data) and Abstracts Views on Vision4Press platform.
Data correspond to usage on the plateform after 2015. The current usage metrics is available 48-96 hours after online publication and is updated daily on week days.
Initial download of the metrics may take a while.