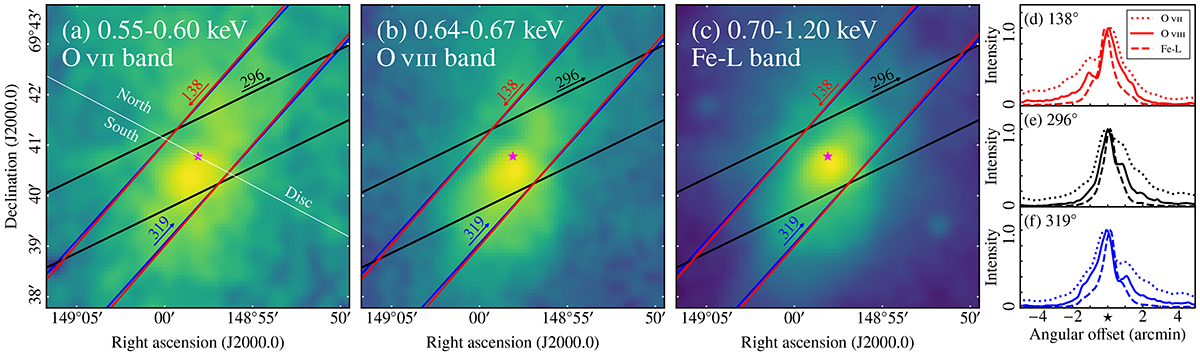
Fig. 1.
Download original image
X-ray images of M 82 and line profiles in the three energy bands. (a) Mosaiced X-ray count image of the centre of M 82 in the O VII (0.55−0.60 keV) band by CCDs. The three representative RGS position angles are overlaid on the 80 arcsec cross-dispersion widths. The arrows indicate the dispersion direction in which the photons are scattered into the higher-energy side. The star and the solid line passing through it indicate the centre and disc of M 82 (Lester et al. 1990; Mayya et al. 2005). The continuum flux estimated using the 0.45−0.55 keV band is subtracted from the raw count image. (b), (c) Same as panel a, but in the O VIII Lyα (0.64−0.67 keV) and Fe-L (0.70−1.20 keV) bands. (d) Normalised count profiles projected onto the 138° dispersion axis in the 0.55−0.60 keV (O VII), 0.64−0.67 keV (O VIII), and 0.70−1.20 keV (dominated by Fe-L lines) bands. The angular offset is measured in reference to the star in panel a, where the positive side of the offset axis is the higher-energy part in diffracted spectra. (e), (f) Same as panel d, but along the dispersion axes of 296° and 319°, respectively.
Current usage metrics show cumulative count of Article Views (full-text article views including HTML views, PDF and ePub downloads, according to the available data) and Abstracts Views on Vision4Press platform.
Data correspond to usage on the plateform after 2015. The current usage metrics is available 48-96 hours after online publication and is updated daily on week days.
Initial download of the metrics may take a while.