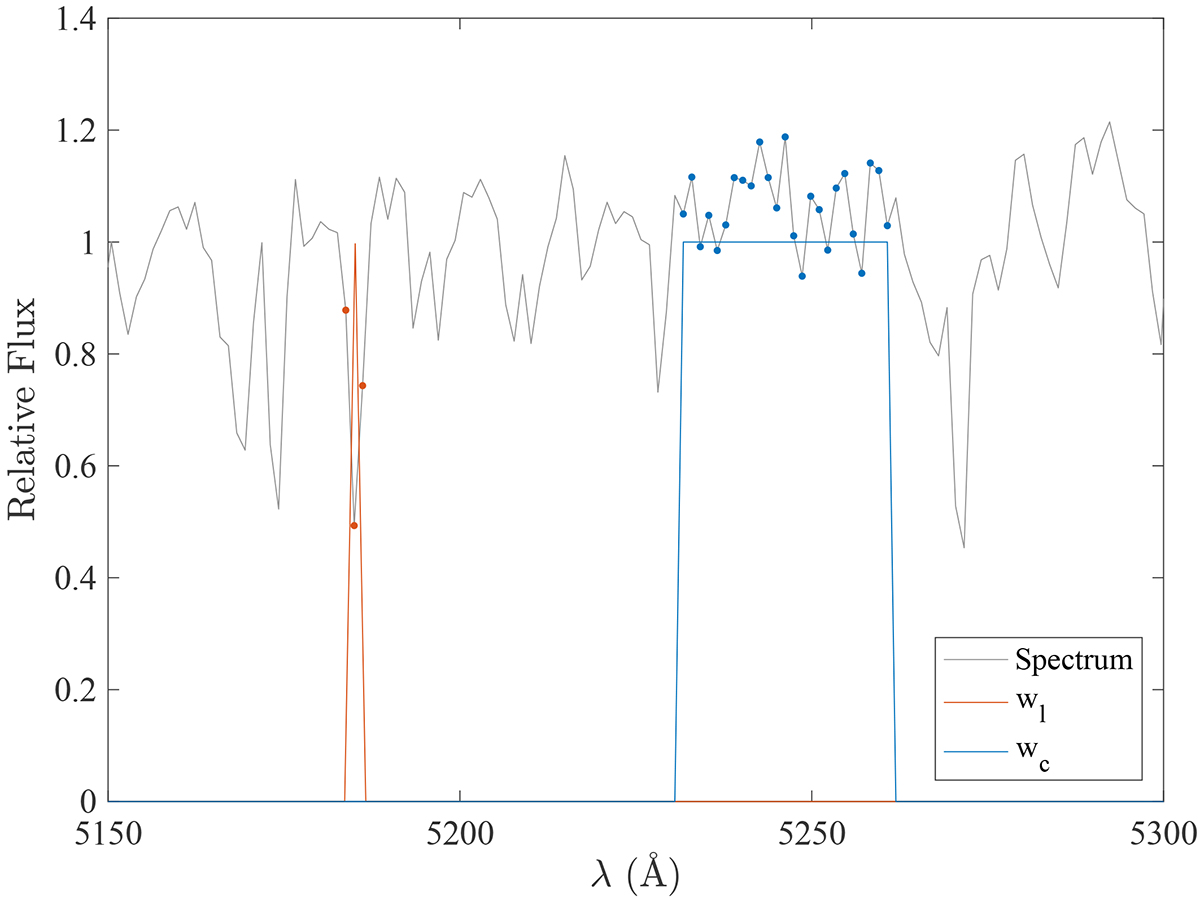
Fig. B.1.
Download original image
Simulated spectrum of a RG star from a PHOENIX spectrum of a star with an effective temperature of 4800 K, surface gravity of 2.5, and [Fe/H] of 0.0 (gray line). Resolution and sampling were downgraded to that of LAMOST. The red line corresponds with the triangular weighting function, wℓ, of the line, ℓ, and the blue line to the flat weighting function, wc, employed for computing the continuum level. Nℓ (red dots) and Nc (blue dots) indicate the points that belong to the triangular and rectangular weighting functions, respectively.
Current usage metrics show cumulative count of Article Views (full-text article views including HTML views, PDF and ePub downloads, according to the available data) and Abstracts Views on Vision4Press platform.
Data correspond to usage on the plateform after 2015. The current usage metrics is available 48-96 hours after online publication and is updated daily on week days.
Initial download of the metrics may take a while.