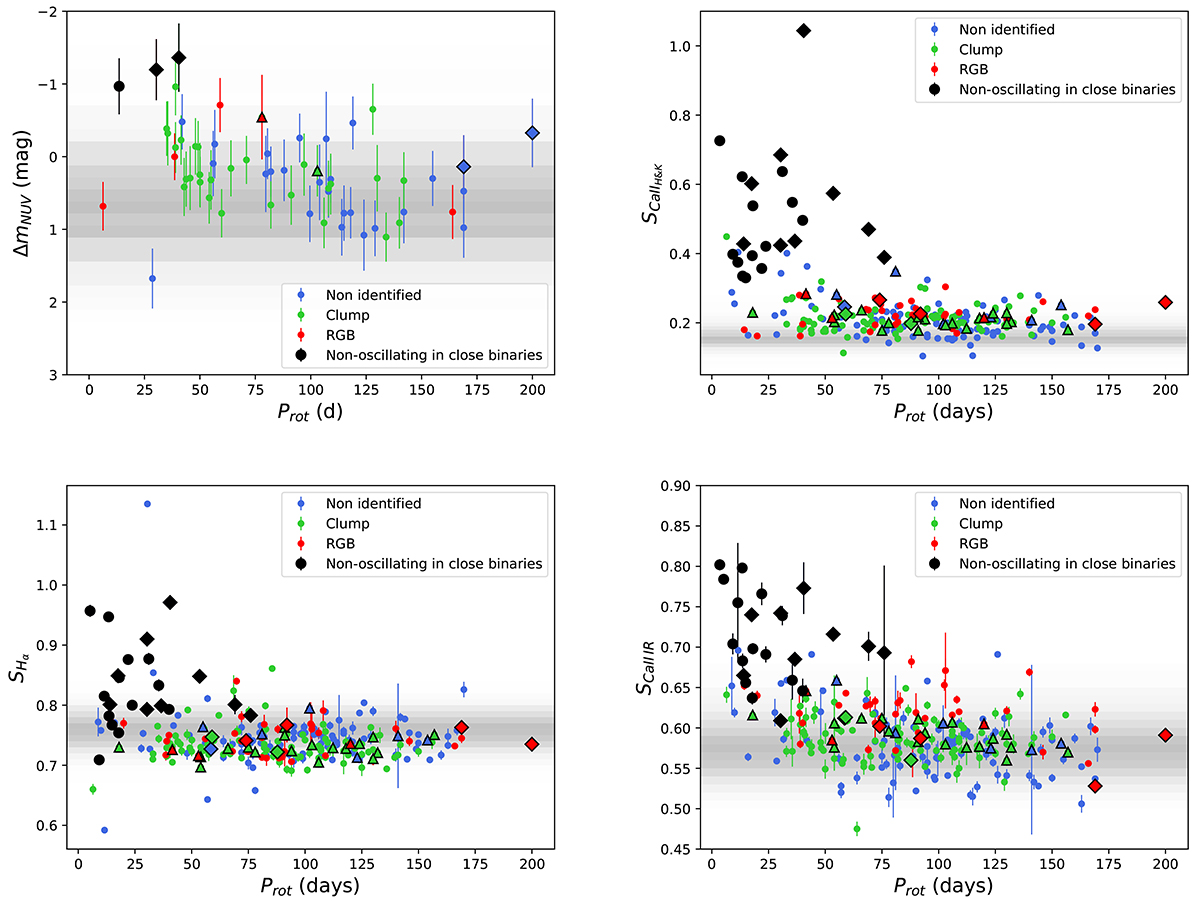
Fig. 5.
Download original image
Activity level as a function of the rotation period, Prot. The RGB and RC stars are represented in red and green, respectively, while RGs with an unidentified evolutionary stage are in blue. Black symbols correspond to non-oscillating RGs in close binaries from Gehan et al. (2022). Triangles and diamonds represent wide (Porb > 150 d) and close (Porb ≤ 150 d) binaries identified by Gaia DR3, respectively. The gray background indicates the distribution of the activity level for inactive stars, where a darker shade corresponds to a larger number of stars. Upper left: ΔmNUV. Upper right: SCa II H&K. Lower left: SHα. Lower right: SCa II IR.
Current usage metrics show cumulative count of Article Views (full-text article views including HTML views, PDF and ePub downloads, according to the available data) and Abstracts Views on Vision4Press platform.
Data correspond to usage on the plateform after 2015. The current usage metrics is available 48-96 hours after online publication and is updated daily on week days.
Initial download of the metrics may take a while.