Fig. 3.
Download original image
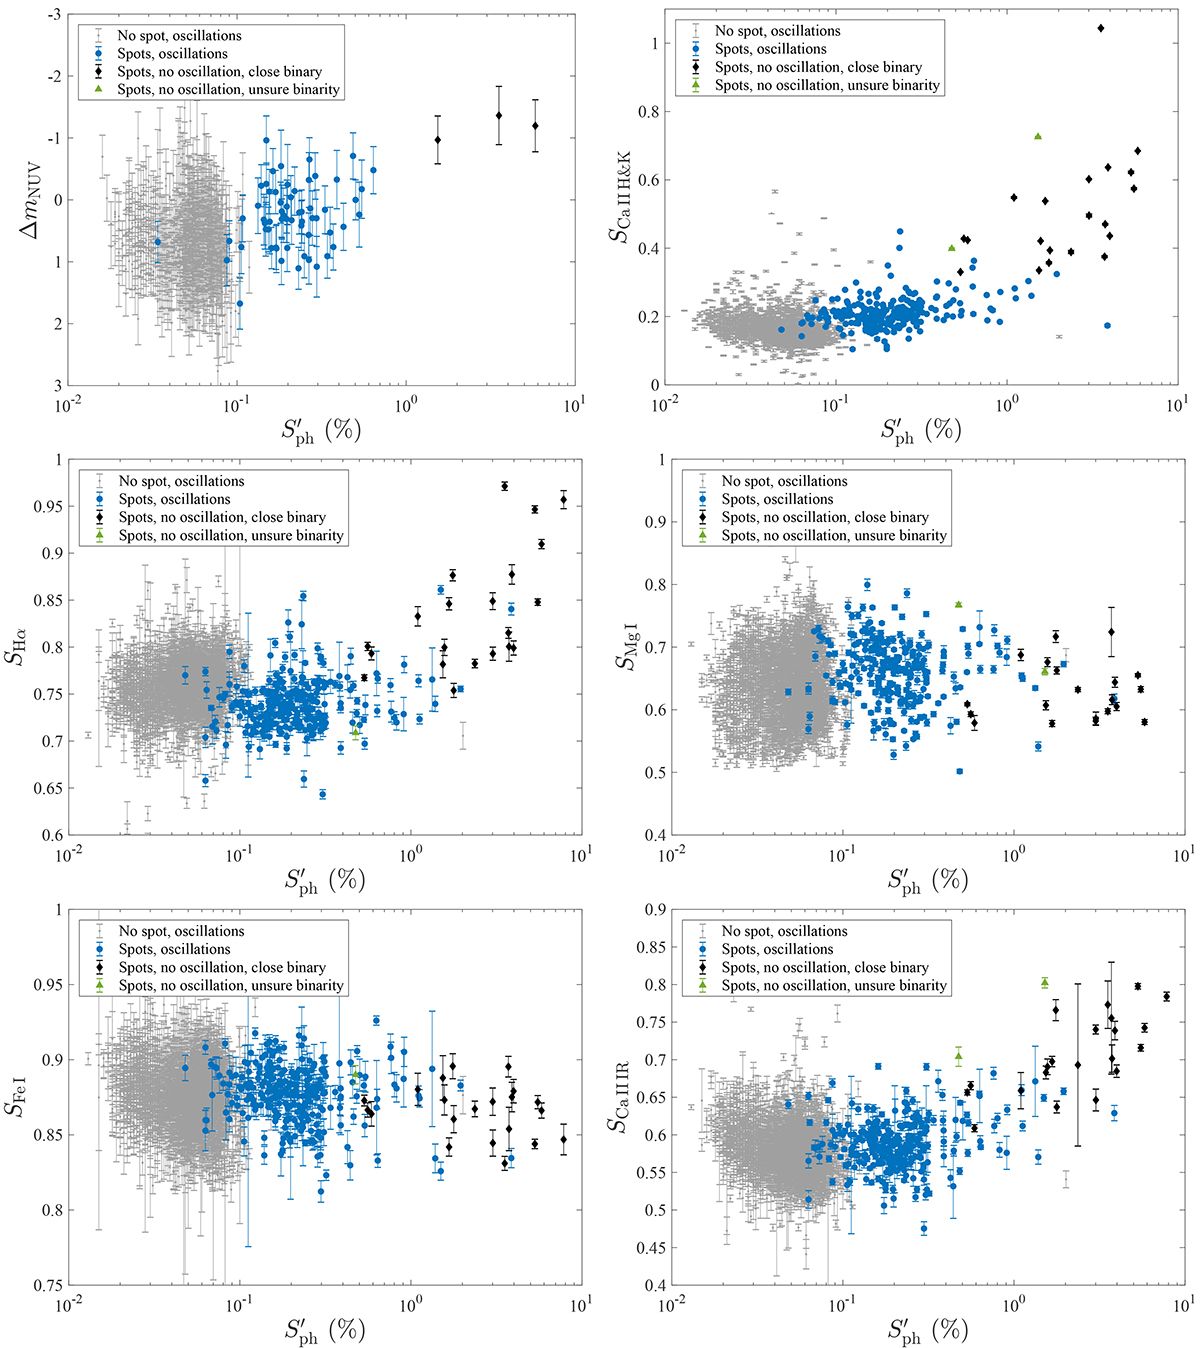
Relation between different activity indicators and the photometric modulation, ![]() , measured by Gaulme et al. (2020) (in log scale), which is an indicator of photospheric activity. The NUV excess, ΔmNUV, is a chromospheric activity indicator measured using GALEX data. The indices, SCa II H&K, SHα, SMg I, and SCa II IR, are chromospheric activity indicators measured using LAMOST data. The index, SFe I, measured using LAMOST data is insensitive to stellar activity and used as a control variable. Gray dots refer to regular photometrically inactive RGs (i.e., with no evidence of spot modulation) that display oscillations. Blue dots refer to photometrically active RGs (i.e., those exhibiting spot modulation) with partially suppressed oscillations. Black dots refer to photometrically active and non-oscillating RGs in close binary systems, which were identified by Gaulme et al. (2020). Green dots refer to non-oscillating RGs with ambiguous binary versus single status; we do not have NUV excess data for these stars.
, measured by Gaulme et al. (2020) (in log scale), which is an indicator of photospheric activity. The NUV excess, ΔmNUV, is a chromospheric activity indicator measured using GALEX data. The indices, SCa II H&K, SHα, SMg I, and SCa II IR, are chromospheric activity indicators measured using LAMOST data. The index, SFe I, measured using LAMOST data is insensitive to stellar activity and used as a control variable. Gray dots refer to regular photometrically inactive RGs (i.e., with no evidence of spot modulation) that display oscillations. Blue dots refer to photometrically active RGs (i.e., those exhibiting spot modulation) with partially suppressed oscillations. Black dots refer to photometrically active and non-oscillating RGs in close binary systems, which were identified by Gaulme et al. (2020). Green dots refer to non-oscillating RGs with ambiguous binary versus single status; we do not have NUV excess data for these stars.
Current usage metrics show cumulative count of Article Views (full-text article views including HTML views, PDF and ePub downloads, according to the available data) and Abstracts Views on Vision4Press platform.
Data correspond to usage on the plateform after 2015. The current usage metrics is available 48-96 hours after online publication and is updated daily on week days.
Initial download of the metrics may take a while.