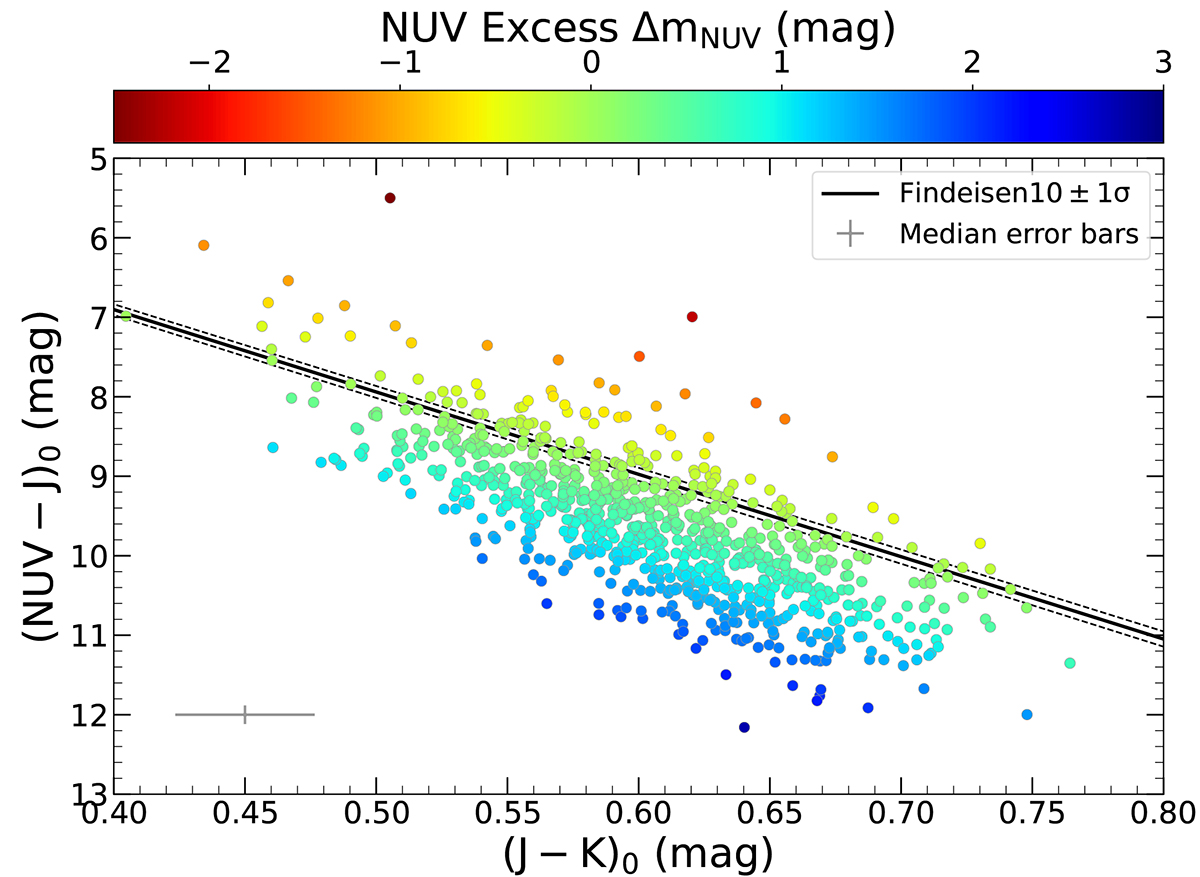
Fig. 1.
Download original image
NUV vs. NIR color-color diagram for the 842 RGs with GALEX NUV magnitudes. From this, the NUV excess was calculated by subtracting the measured (NUV-J)0 magnitudes and the expected values given the fiducial relation from Findeisen & Hillenbrand (2010) and the measured (J − K)0 colors. The targets are color-coded by their NUV excess values, with redder colors indicating stronger excess (more negative values). The gray symbol represents the median error bars.
Current usage metrics show cumulative count of Article Views (full-text article views including HTML views, PDF and ePub downloads, according to the available data) and Abstracts Views on Vision4Press platform.
Data correspond to usage on the plateform after 2015. The current usage metrics is available 48-96 hours after online publication and is updated daily on week days.
Initial download of the metrics may take a while.