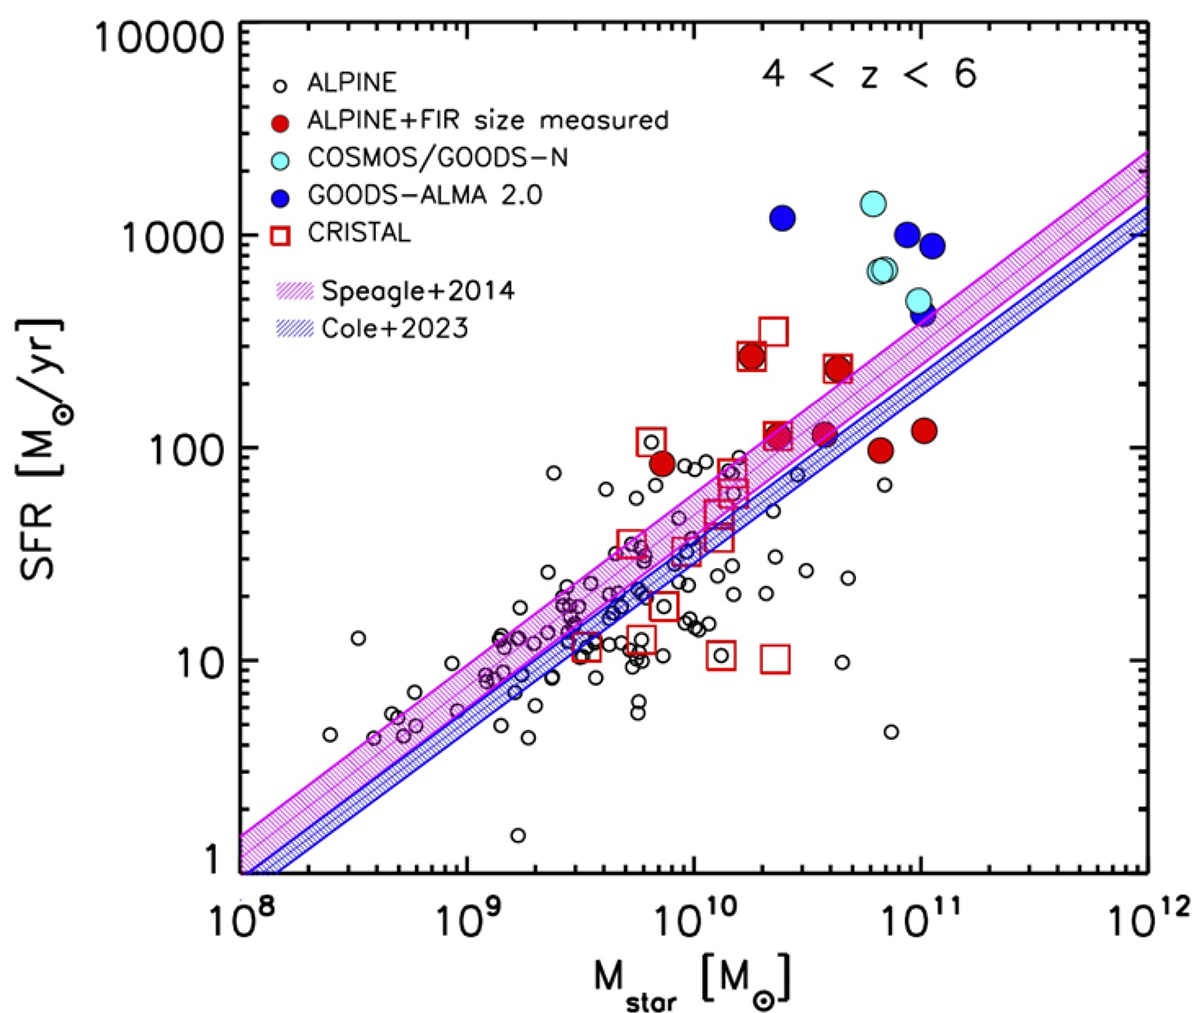
Fig. 1.
Download original image
SFR versus M⋆ for the ALPINE targets (red circles indicate galaxies with a FIR size measurement from the present work) and for our compilation of dust continuum measured sizes from the literature in a similar redshift range, 4 < z < 6 (blue circles represent COSMOS/GOODS-North galaxies from super-deblended catalogues (Jin et al. 2022); cyan circles represent galaxies from the GOODS-ALMA 2.0 survey (Gómez-Guijarro et al. 2022a); and empty red squares represent galaxies from the CRISTAL survey (Mitsuhashi et al. 2023). For the CRISTAL sources that do not belong to the ALPINE survey, we used the SFR and M⋆ values reported in Table 1 of Mitsuhashi et al. (2023). The shaded violet region represents the 1σ range of the MS relation found by Cole et al. (2023) in the redshift range closer to the data (4.5 < z < 5) and obtained using the SFR values derived by averaging the star formation histories over 100 Myr timescales (see Table 2 in Cole et al. 2023); and the shaded pink region represents the MS relation and its 1σ dispersion found by Speagle et al. (2014) and computed, for consistency, at z = 4.75.
Current usage metrics show cumulative count of Article Views (full-text article views including HTML views, PDF and ePub downloads, according to the available data) and Abstracts Views on Vision4Press platform.
Data correspond to usage on the plateform after 2015. The current usage metrics is available 48-96 hours after online publication and is updated daily on week days.
Initial download of the metrics may take a while.