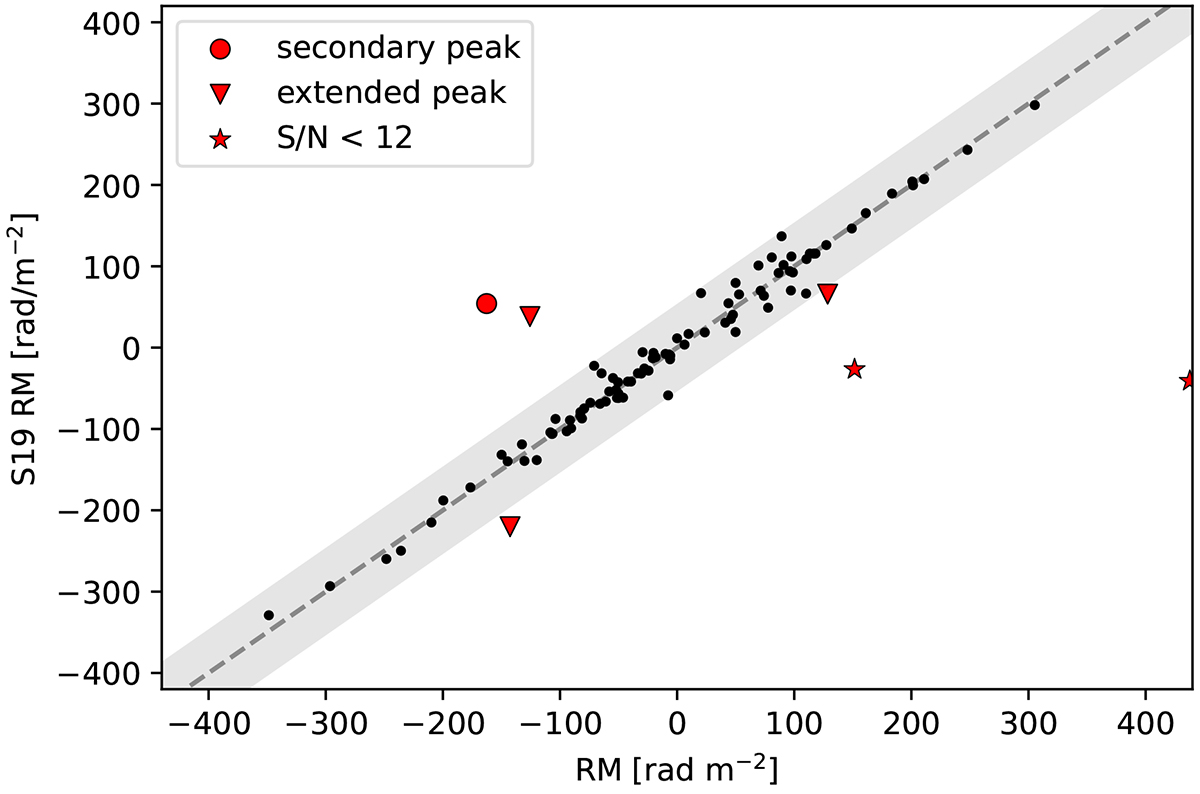
Fig. 8.
Download original image
Comparison between the measured ϕ from this work and those from S19. The uncertainties on our ϕ measurements are typically of order ∼1 rad m−2 and are not visible on the scale of this plot. The shaded region indicates 5σ of the residuals. The outliers beyond this are plotted in accordance with the explanation in the main text. Cases (i), (ii) and (iii) are plotted as red stars, circles and triangles, respectively.
Current usage metrics show cumulative count of Article Views (full-text article views including HTML views, PDF and ePub downloads, according to the available data) and Abstracts Views on Vision4Press platform.
Data correspond to usage on the plateform after 2015. The current usage metrics is available 48-96 hours after online publication and is updated daily on week days.
Initial download of the metrics may take a while.