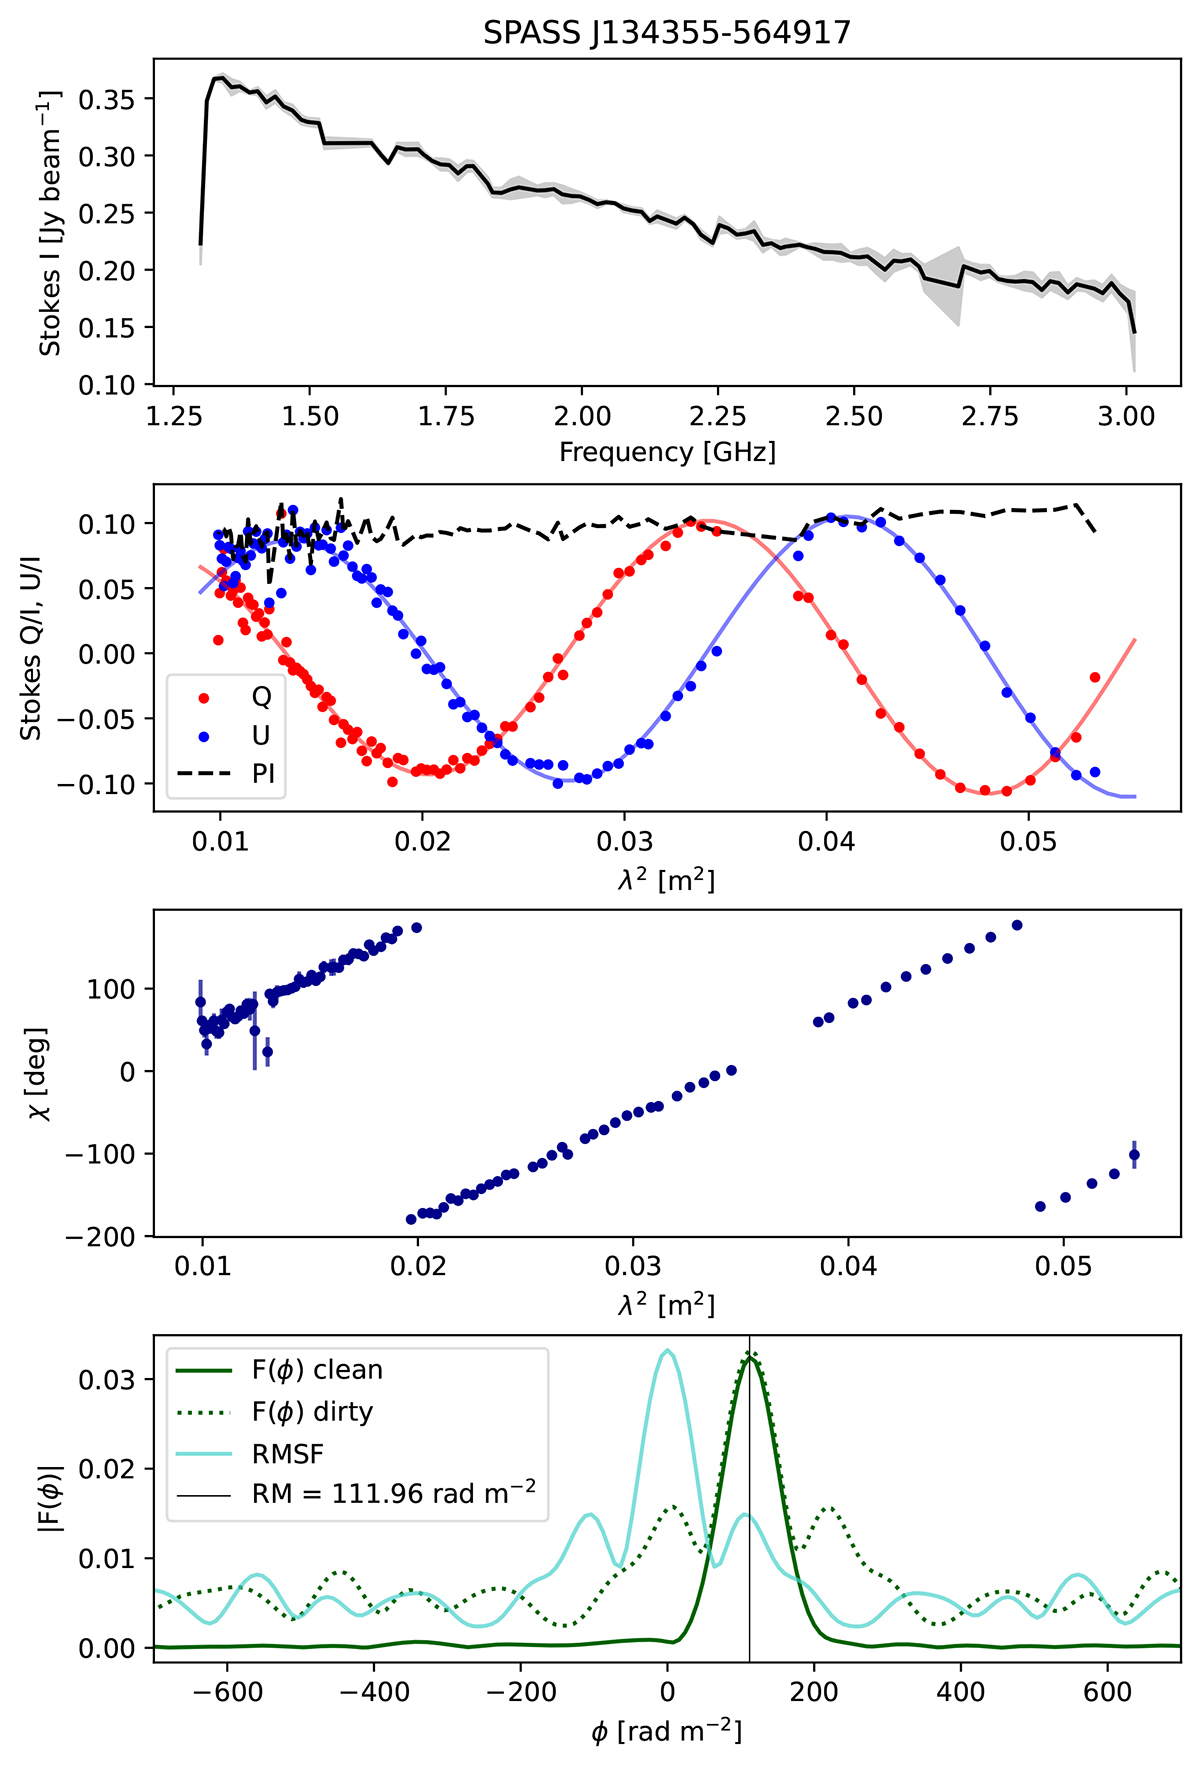
Fig. 4.
Download original image
Example of the spectra for source SPASS J134355−564917. From top to bottom: panel 1 shows the total intensity spectrum as a function of frequency. Panel 2 shows the Stokes Q/I and U/I spectra as a function of λ2, with the fractional polarisation spectrum indicated by the dashed line. The fitted models for Stokes Q/I and U/I are also shown. In panels 1 and 2, the shaded regions indicate the uncertainties. Panel 3 shows the polarisation angle as a function of λ2. Panel 4 shows the dirty (green dotted) and cleaned (green solid) Faraday spectrum with the Rotation Measure Spread Function (RMSF) in cyan. The black vertical line shows the peak Faraday depth.
Current usage metrics show cumulative count of Article Views (full-text article views including HTML views, PDF and ePub downloads, according to the available data) and Abstracts Views on Vision4Press platform.
Data correspond to usage on the plateform after 2015. The current usage metrics is available 48-96 hours after online publication and is updated daily on week days.
Initial download of the metrics may take a while.