Fig. 15.
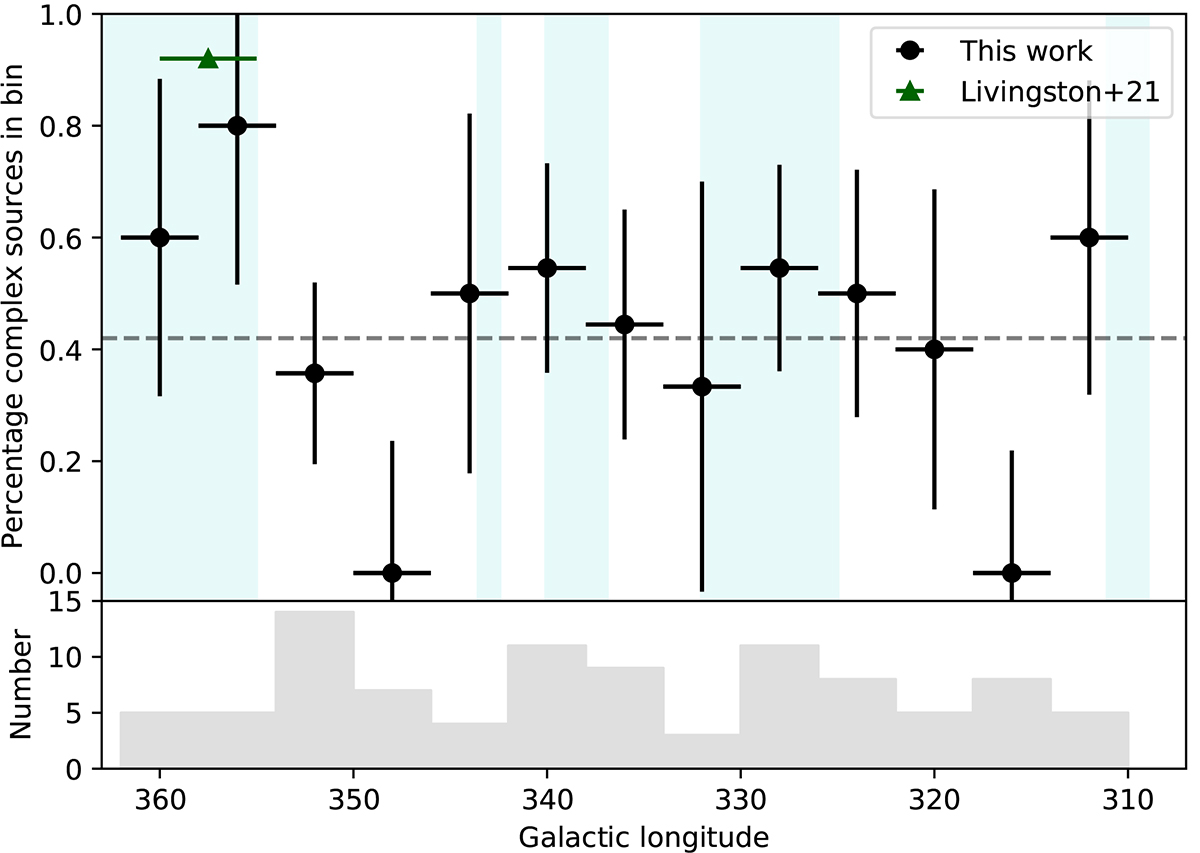
Download original image
Percentage of complex sources for each longitude bin of 4 deg (black circles). The x error bars indicate the extent of the bin, and the y errors are determined through bootstrapping. The dashed line shows the percentage of complex sources for the full sample at 42%. The cyan-shaded regions indicate longitudes which correspond to the Galactic spiral arms listed in the text and the longitude range within 5 degrees of the Galactic centre. The bottom panel is a histogram showing the number of sources in each longitude bin. The green triangle shows the percentage of complex sources at 355° < l < 360° in Livingston et al. (2021).
Current usage metrics show cumulative count of Article Views (full-text article views including HTML views, PDF and ePub downloads, according to the available data) and Abstracts Views on Vision4Press platform.
Data correspond to usage on the plateform after 2015. The current usage metrics is available 48-96 hours after online publication and is updated daily on week days.
Initial download of the metrics may take a while.