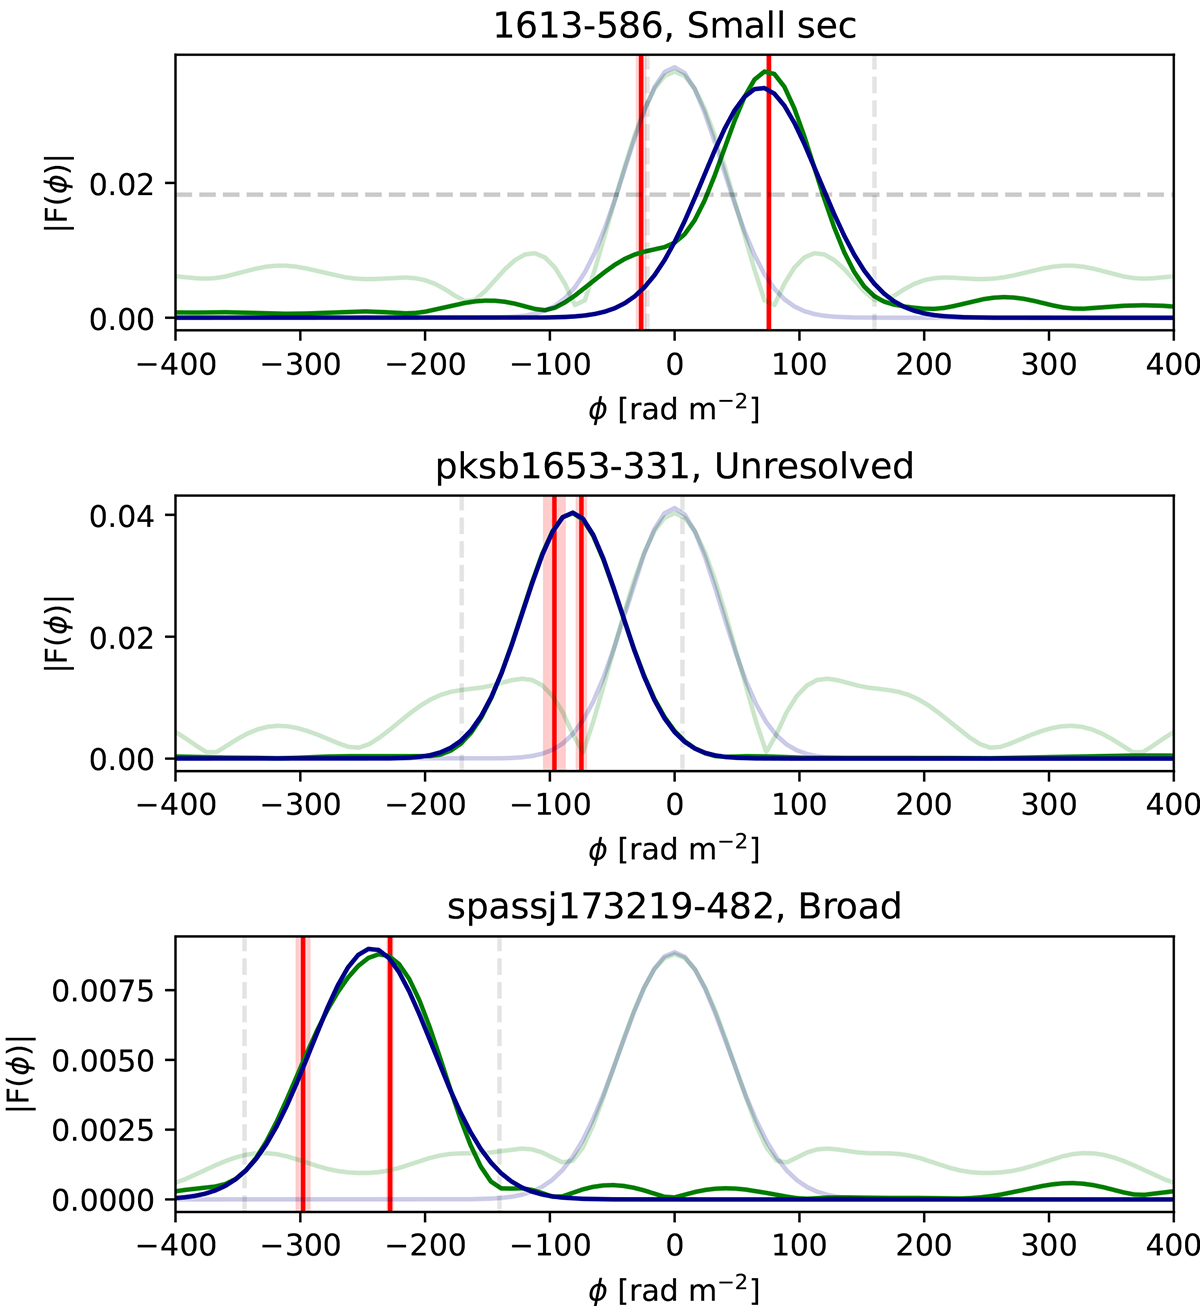
Fig. 14.
Download original image
Examples of the Faraday spectrum classes ‘small sec’ (top), ‘unresolved’ (centre), and ‘broad’ (bottom) as described in Sect. 5.2.1. The plots show the Faraday spectrum (green) and the fitted Gaussian (blue). The same is shown for the RMSF and its Gaussian fit, in lower opacity. The red vertical lines show the fitted ϕ from QU fitting and their uncertainties. The 3σ extent and the half-maximum amplitude of the fitted Gaussians are indicated with dashed grey lines.
Current usage metrics show cumulative count of Article Views (full-text article views including HTML views, PDF and ePub downloads, according to the available data) and Abstracts Views on Vision4Press platform.
Data correspond to usage on the plateform after 2015. The current usage metrics is available 48-96 hours after online publication and is updated daily on week days.
Initial download of the metrics may take a while.