Fig. 12.
Download original image
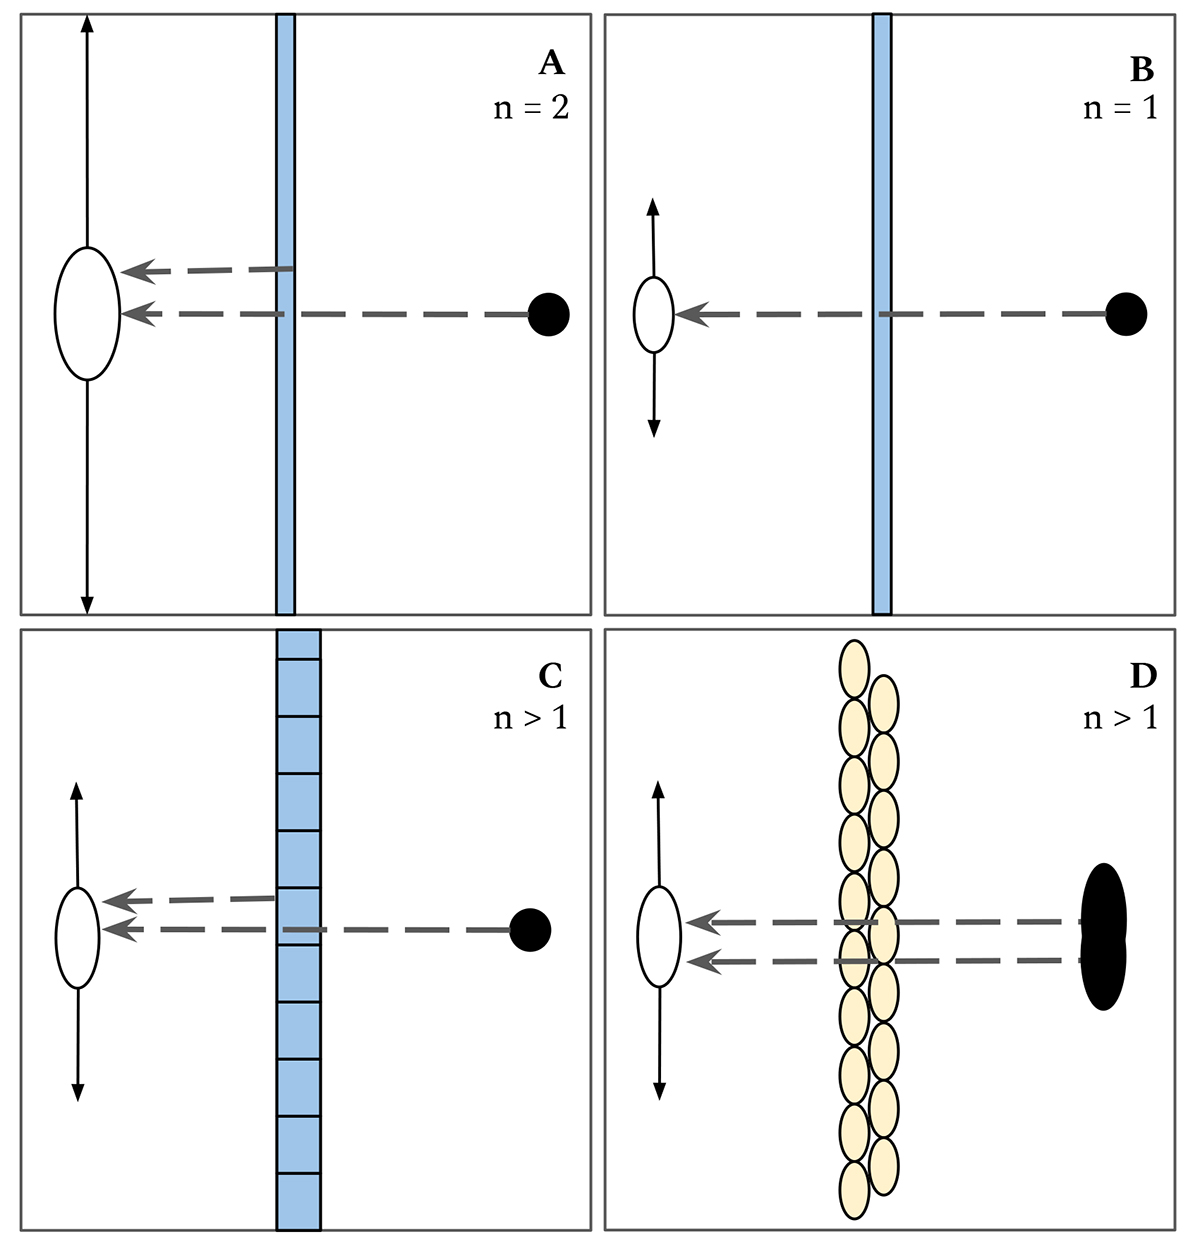
Diagram illustrating the effect of multi-resolution observations on the interpretation of Faraday complexity. The black circle indicates a linearly polarised, synchrotron-emitting source, spatially unresolved in A, B and C. The white ellipse indicates the angular resolution of the observations, and the vertical arrows indicate the maximum angular scale of the observations. The blue-shaded regions are the polarised emitting foreground, with emission at smaller scales in panel C, and the yellow-shaded region is a turbulent foreground screen. The dashed arrows show the paths of emission from the various sources, and the number of observed Faraday components is indicated in the top right corner.
Current usage metrics show cumulative count of Article Views (full-text article views including HTML views, PDF and ePub downloads, according to the available data) and Abstracts Views on Vision4Press platform.
Data correspond to usage on the plateform after 2015. The current usage metrics is available 48-96 hours after online publication and is updated daily on week days.
Initial download of the metrics may take a while.