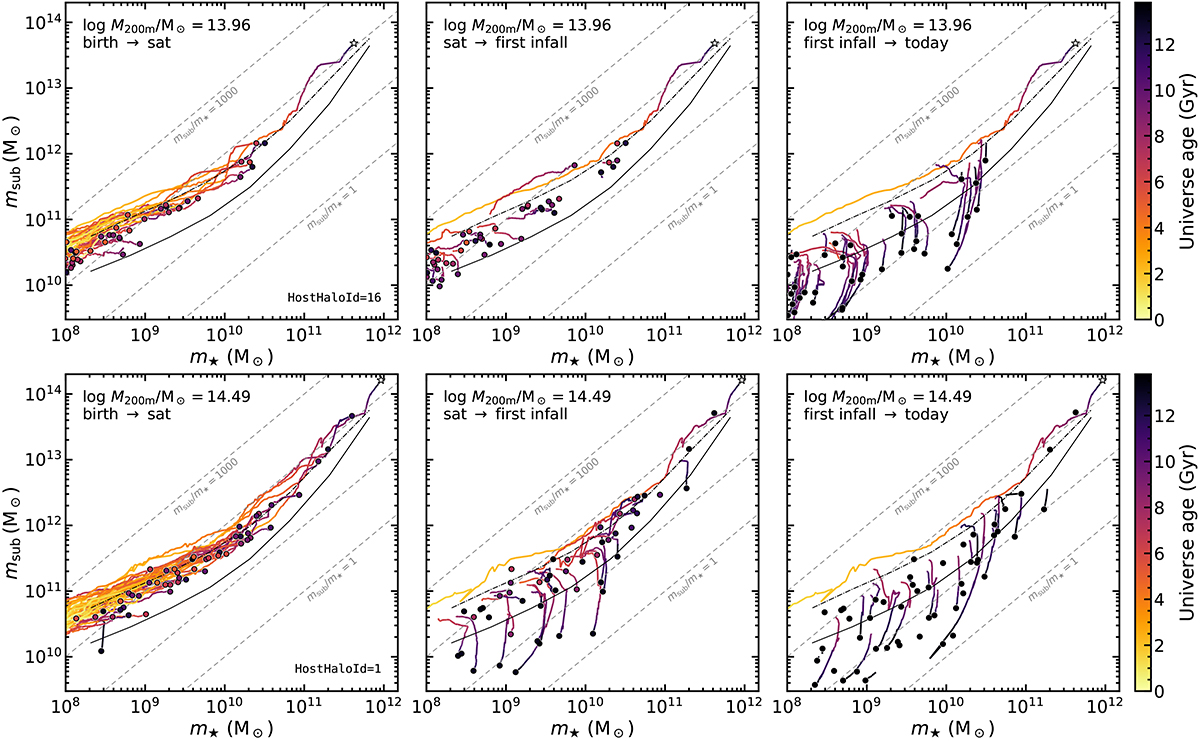
Fig. 9.
Download original image
Evolution in the subhalo mass-stellar mass plane within two randomly selected clusters in EAGLE, one in the low-mass end and the other in the high-mass end of our sample (HostHaloId 16 and 1 at z = 0 in the HBT+ catalogue, respectively). From left to right, we show the motion in the msub − m⋆ plane of 38 and 50 subhaloes within each cluster, respectively, selected randomly to span the full stellar mass range explored in this work but including the six most massive subhaloes (including the central subhalo, whose track ends on a white star), and only selecting satellites with tsat < 12 Gya (see Sect. 4.1). Subhaloes with present-day stellar masses m⋆ < 109 M⊙ are shown here for illustration, but are not part of the sample analysed in this work. All three panels show the same subhaloes per host. As labelled in the top left, each panel shows the time span between the birth of a subhalo and the first time they were labelled a satellite of any host (left), since then until they fell into their present host for the first time (middle), and from first infall until the present day (right), except for the track of the central subhalo which is reproduced from birth to the present day in all panels. Each subhalo’s history is colour-coded by age of the Universe. The thin solid and dash-dotted black lines show the present-day satellite and central SHSMR, respectively, for reference. The grey dashed diagonal lines show constant subhalo-to-stellar mass ratios, increasing by factors of ten from bottom to top, as labelled.
Current usage metrics show cumulative count of Article Views (full-text article views including HTML views, PDF and ePub downloads, according to the available data) and Abstracts Views on Vision4Press platform.
Data correspond to usage on the plateform after 2015. The current usage metrics is available 48-96 hours after online publication and is updated daily on week days.
Initial download of the metrics may take a while.