Fig. 6.
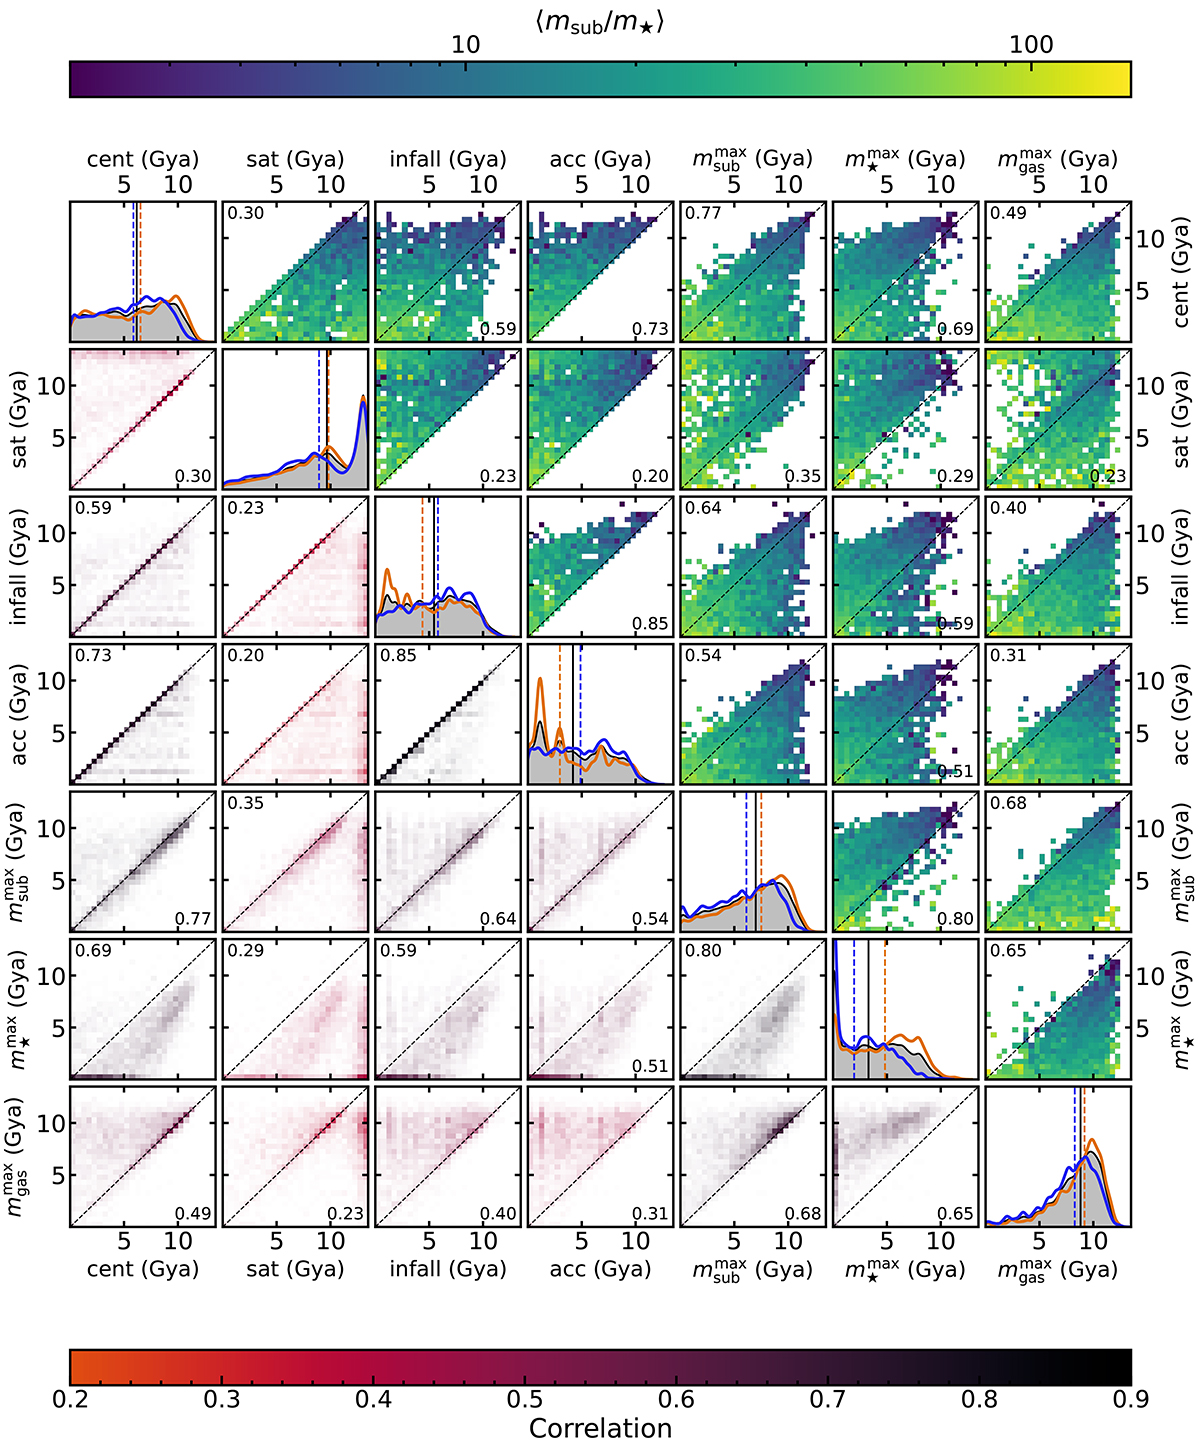
Download original image
Correlation between the different lookback times listed in Table 2 (in units of Gya). The diagonal panels show kernel density estimates of each lookback time distribution, using a Gaussian kernel with σ = 0.1 Gyr, and the median marked by a blue line. The orange and blue curves and dashed vertical lines show distributions and medians for satellites in M200m > 1014 M⊙ and 1013 M⊙ < M200m < 5 × 10¹³ M⊙. Each off-diagonal panel in the lower triangle shows the corresponding two-dimensional occupation; the colour scale runs from white (zero) to a colour given by the Spearman correlation coefficient between the two times, shown in the corner of each panel, and coded in the bottom colour bar. The brightness scaling is consistent across panels, with the darkest cells containing 2.5% of the population or more. Each panel in the upper triangle shows the logarithm of the mean subhalo-to-stellar mass ratio at z = 0 in each cell, as coded in the upper colour bar. The numbers in the corners of each panel correspond to the correlation coefficients.
Current usage metrics show cumulative count of Article Views (full-text article views including HTML views, PDF and ePub downloads, according to the available data) and Abstracts Views on Vision4Press platform.
Data correspond to usage on the plateform after 2015. The current usage metrics is available 48-96 hours after online publication and is updated daily on week days.
Initial download of the metrics may take a while.