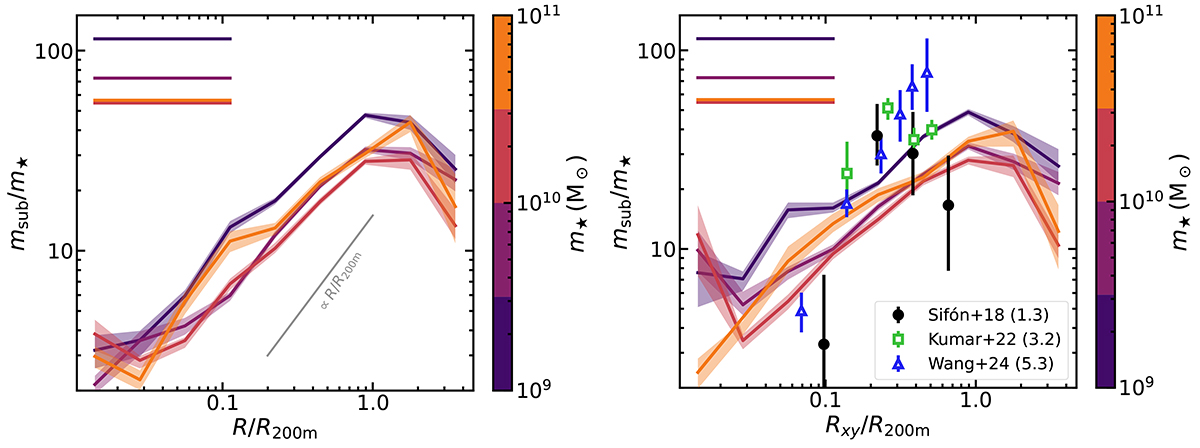
Fig. 3.
Download original image
Total-to-stellar mass ratio (SHSMR) as a function of cluster-centric distance normalized by cluster size, R200m, binned by stellar mass. Horizontal lines in the top left show the mean SHSMR for centrals in each stellar mass bin. Left: 3D distances. The straight grey line shows a linear dependence with cluster-centric distance, for reference. Right: distances projected along the z direction. Weak lensing measurements from Sifón et al. (2018), Kumar et al. (2022), and Wang et al. (2024) are shown with black circles, green squares, and blue triangles, respectively. Numbers in parentheses correspond to the mean stellar mass in each study, in units of 1010 M⊙.
Current usage metrics show cumulative count of Article Views (full-text article views including HTML views, PDF and ePub downloads, according to the available data) and Abstracts Views on Vision4Press platform.
Data correspond to usage on the plateform after 2015. The current usage metrics is available 48-96 hours after online publication and is updated daily on week days.
Initial download of the metrics may take a while.