Fig. 13.
Download original image
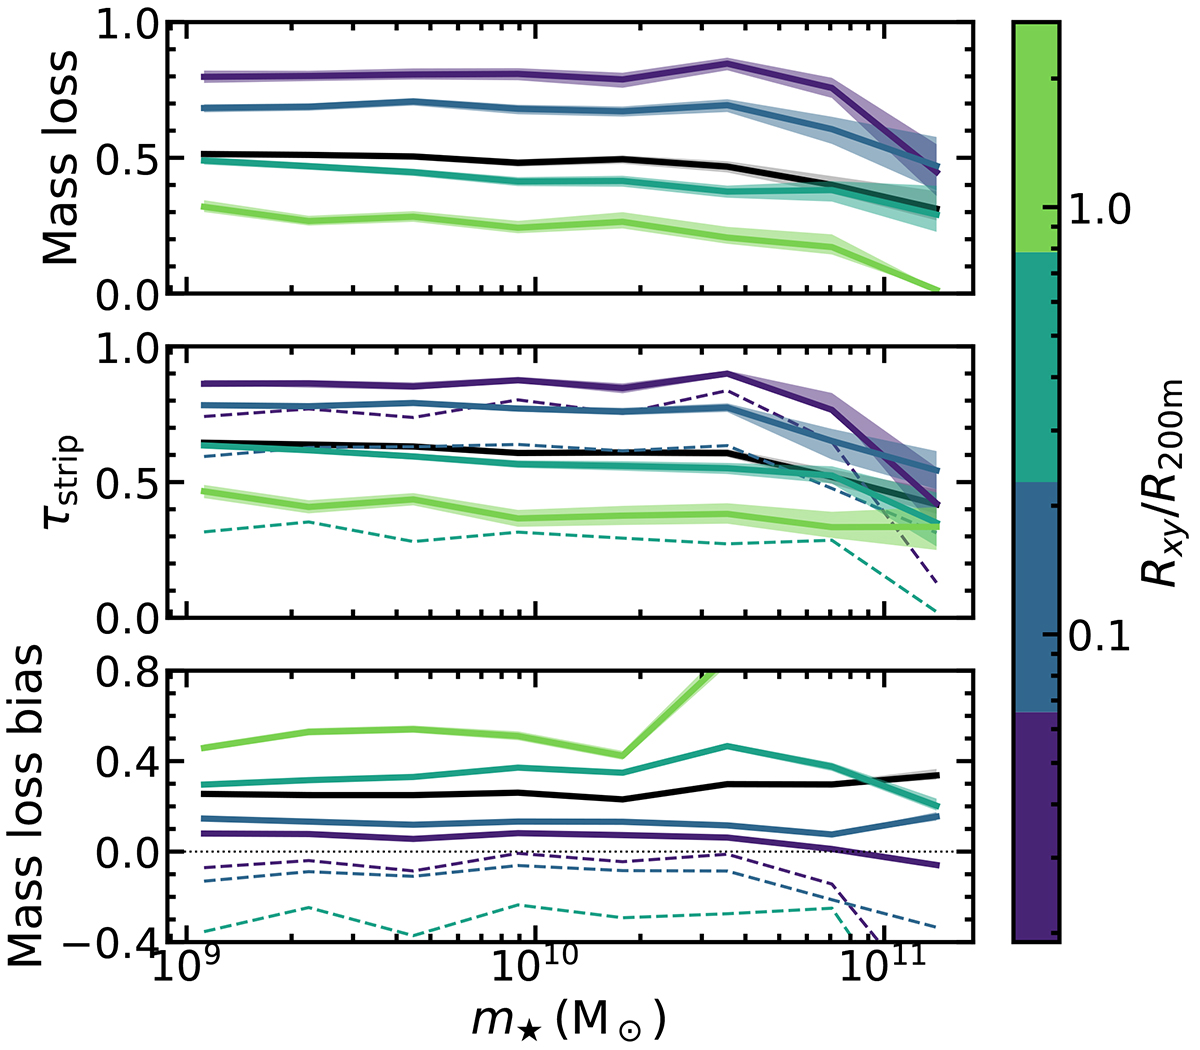
Bias incurred in the estimation of mass loss by assuming it can be calculated as the ratio of satellite to central subhalo mass at fixed stellar mass (bottom). This bias is calculated as the ratio of the present-day to maximum subhalo mass (i.e. mass loss itself; top), and τstrip = 1 − msat/mcentral (i.e. the observational proxy; middle). All curves are colour-coded by projected cluster-centric distance normalized by R200m, and the shaded regions show corresponding normal uncertainties. The dashed lines correspond to using the outermost bin in the denominator instead; see Sect. 6 for details. The black lines show quantities for all satellites together.
Current usage metrics show cumulative count of Article Views (full-text article views including HTML views, PDF and ePub downloads, according to the available data) and Abstracts Views on Vision4Press platform.
Data correspond to usage on the plateform after 2015. The current usage metrics is available 48-96 hours after online publication and is updated daily on week days.
Initial download of the metrics may take a while.