Fig. 10.
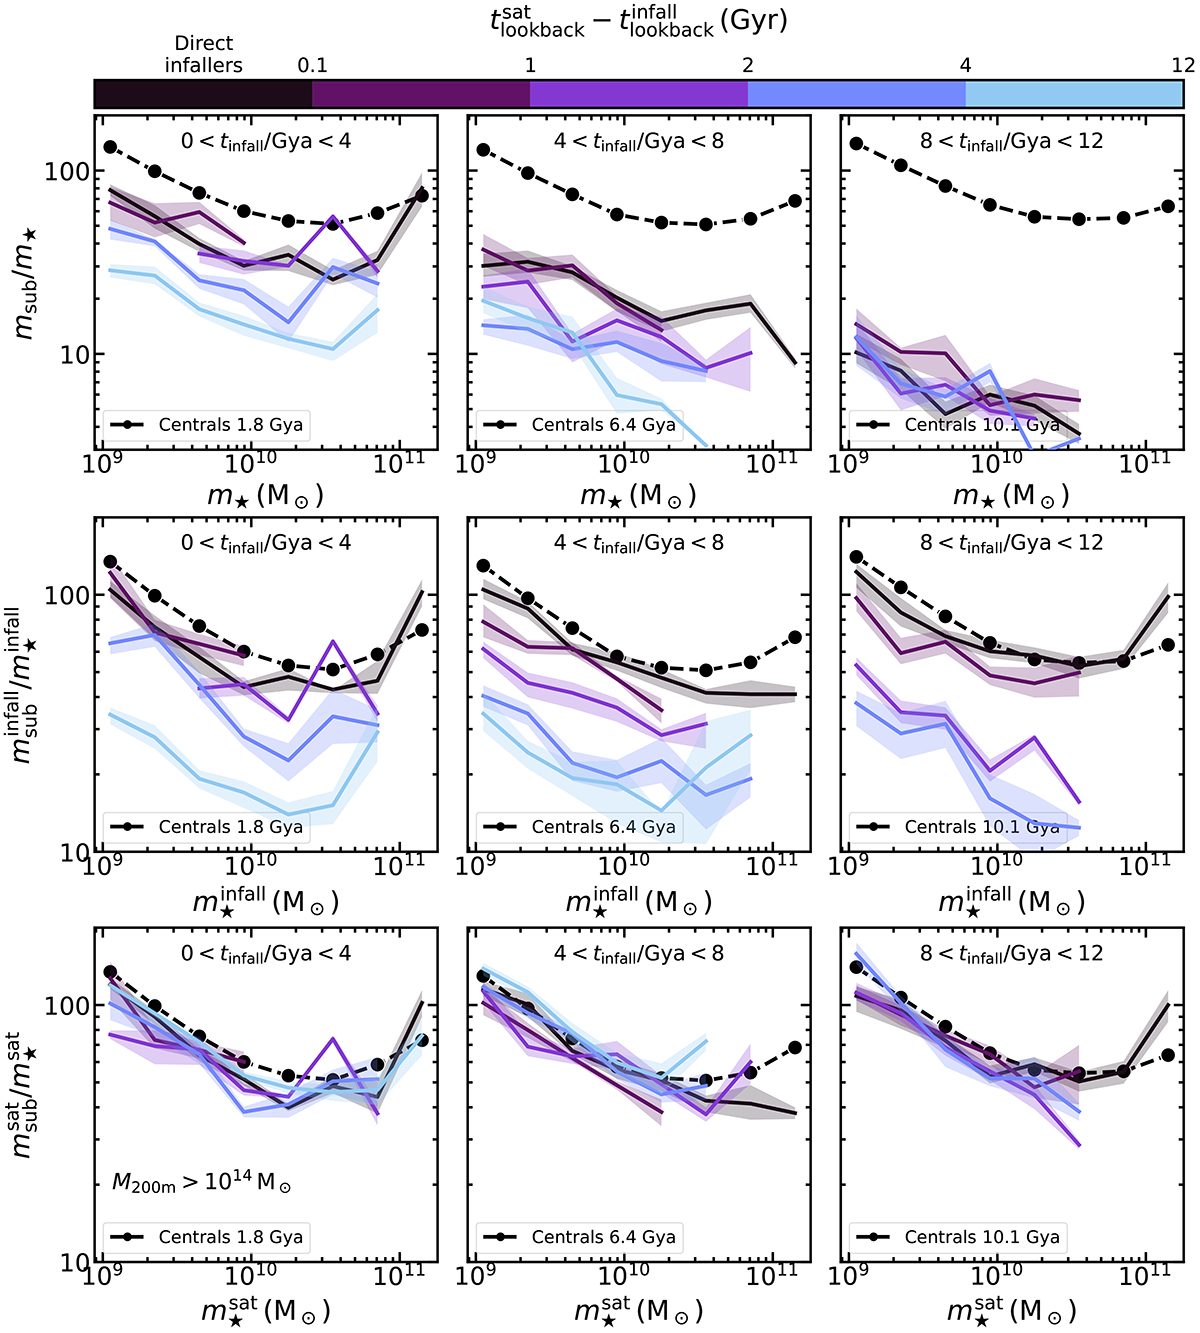
Download original image
Pre- and post-processing of the satellite SHSMR. From top to bottom are shown the SHSMR at z = 0, at the time of infall to the present host and at the time each galaxy was labelled a satellite for the first time. From left to right are shown increasing times since infall, as labelled. The black solid lines show the SHSMR for galaxies that fell in to their present hosts as centrals, while the coloured lines show galaxies that fell in as satellites of another host, colour-coded by time elapsed between first being labelled a satellite and falling into the present host, for satellites residing in M200m > 1014 M⊙ only. The black dashed lines with circles show the SHSMR of central galaxies at the median infall time of each sample. The shaded regions show normal uncertainties on the mean. The vertical scale is different in each row.
Current usage metrics show cumulative count of Article Views (full-text article views including HTML views, PDF and ePub downloads, according to the available data) and Abstracts Views on Vision4Press platform.
Data correspond to usage on the plateform after 2015. The current usage metrics is available 48-96 hours after online publication and is updated daily on week days.
Initial download of the metrics may take a while.