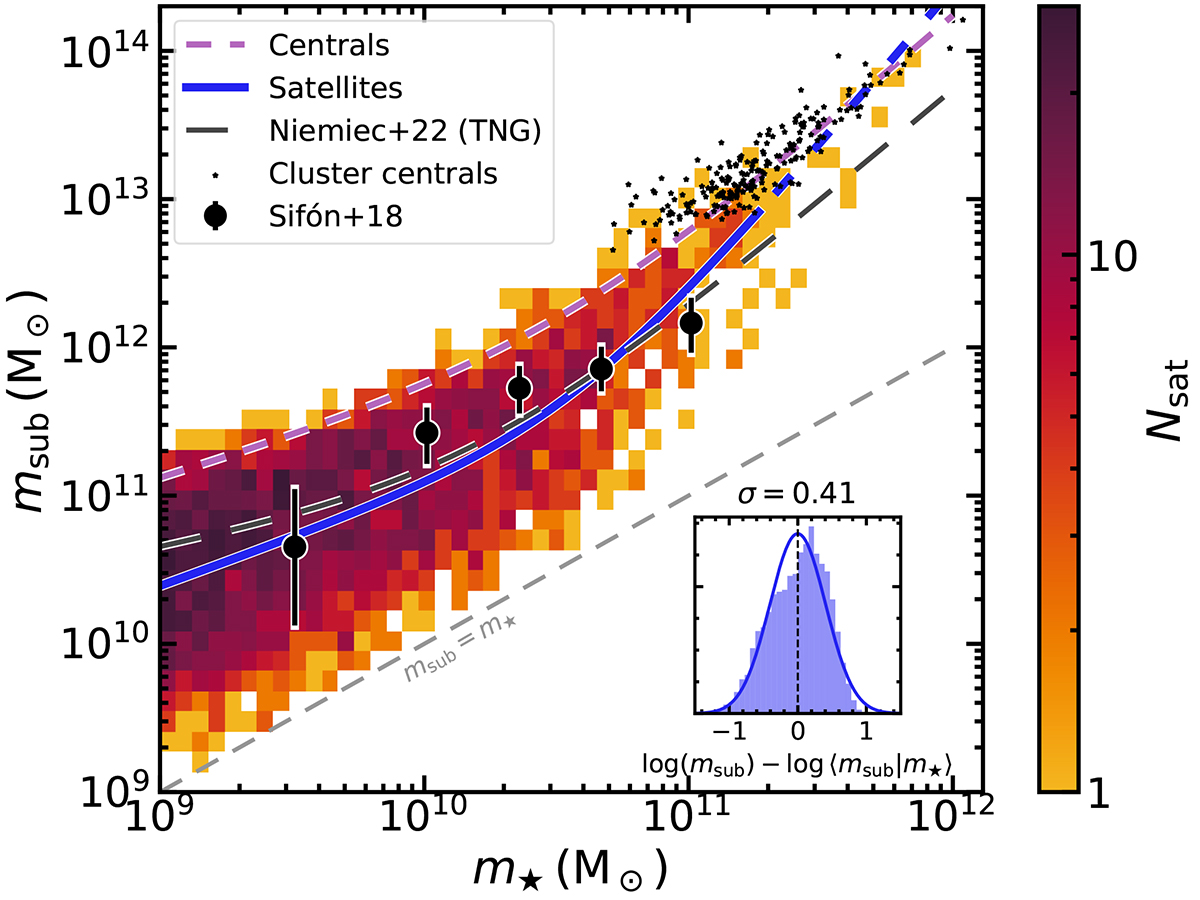
Fig. 1.
Download original image
Subhalo-to-stellar mass relation (SHSMR) for satellite galaxies in galaxy clusters with masses M200m > 1013 M⊙ in the EAGLE simulation. The coloured background shows the occupation of the msub − m⋆ plane, while the thick blue line shows the best-fitting Eq. (1), which has been fit only over the range in which the blue line is solid. The dashed magenta line shows the corresponding fit to central galaxies while black dots show the centrals in the M200m > 1013 M⊙ clusters included in this work. The dashed black line black line shows the satellite SHSMR in IllustrisTNG (Niemiec et al. 2022) and large circles with error bars show the weak lensing measurements of Sifón et al. (2018). The inset shows the logarithmic scatter around the mean relation, which can be approximated by a lognormal distribution with standard deviation σ = 0.41.
Current usage metrics show cumulative count of Article Views (full-text article views including HTML views, PDF and ePub downloads, according to the available data) and Abstracts Views on Vision4Press platform.
Data correspond to usage on the plateform after 2015. The current usage metrics is available 48-96 hours after online publication and is updated daily on week days.
Initial download of the metrics may take a while.