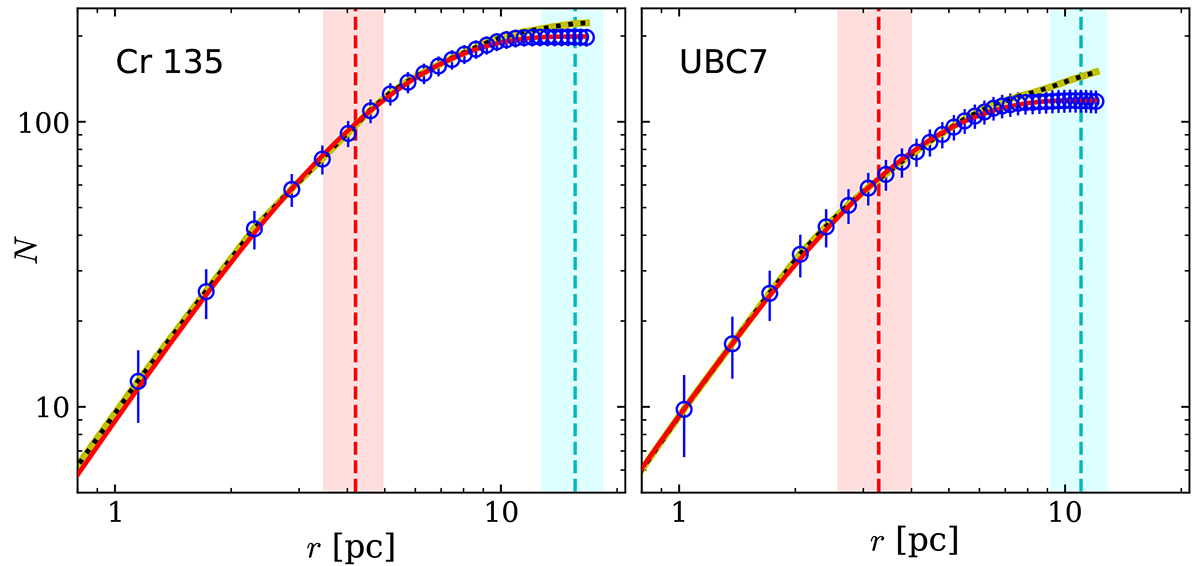
Fig. 9.
Download original image
Fits of the King profile according to Eq. (5) for the observed radial density profiles, based on the confident members of the clusters. The curves present distributions including the residual background stars (black dots on the yellow lines), the distributions corrected for the background (circles with statistical error bars), and the fitted King profiles (solid red curves). The vertical dashed lines show the core and tidal radii (rc and rt). The colour bands show errors in the radii.
Current usage metrics show cumulative count of Article Views (full-text article views including HTML views, PDF and ePub downloads, according to the available data) and Abstracts Views on Vision4Press platform.
Data correspond to usage on the plateform after 2015. The current usage metrics is available 48-96 hours after online publication and is updated daily on week days.
Initial download of the metrics may take a while.