Fig. 13.
Download original image
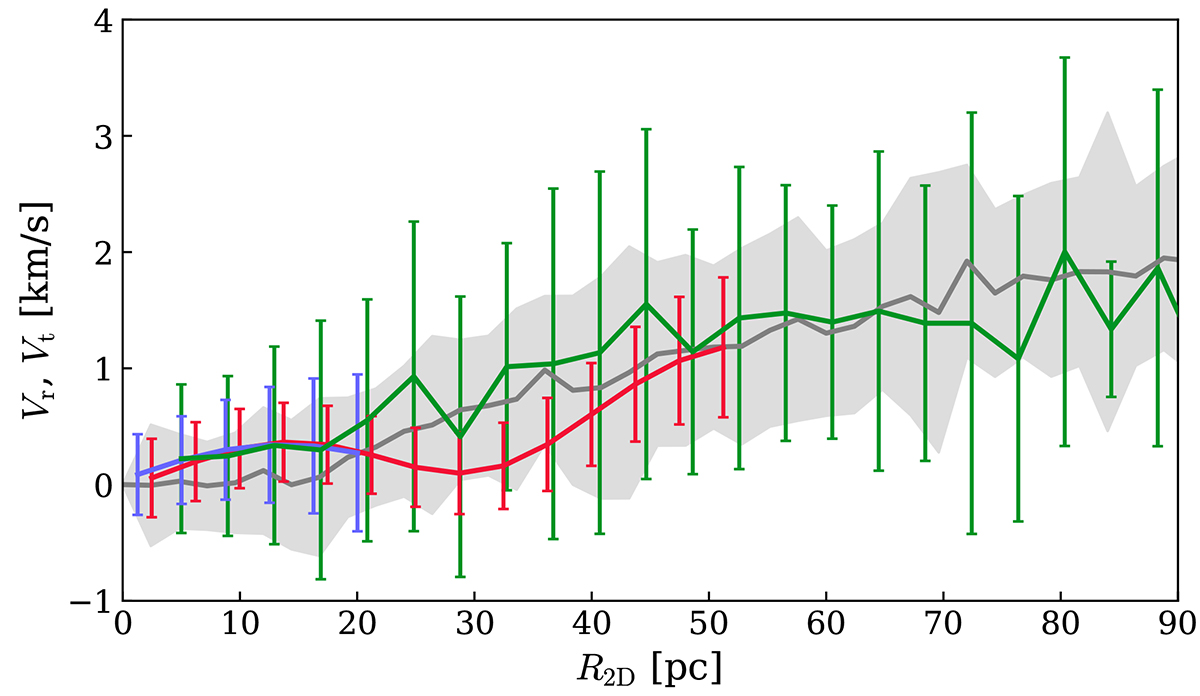
Outwards motion of the corona stars with respect to the pair of star clusters’ centre of mass. Smoothed magnitudes Vr of residual line-of-sight velocities of receding (approaching) stars from Gaia DR3 are shown by red (blue) lines. The mean residual tangential velocities in the picture plane Vt are shown by the green line. The grey line shows the mean tangential components of the runaway velocities obtained in N-body simulations for the Dehnen γ = 0 initial stellar profile with SFE = 0.05 after 50 Myr of evolution (Shukirgaliyev et al. 2021), where the shadow represents the uncertainty.
Current usage metrics show cumulative count of Article Views (full-text article views including HTML views, PDF and ePub downloads, according to the available data) and Abstracts Views on Vision4Press platform.
Data correspond to usage on the plateform after 2015. The current usage metrics is available 48-96 hours after online publication and is updated daily on week days.
Initial download of the metrics may take a while.