Fig. 11.
Download original image
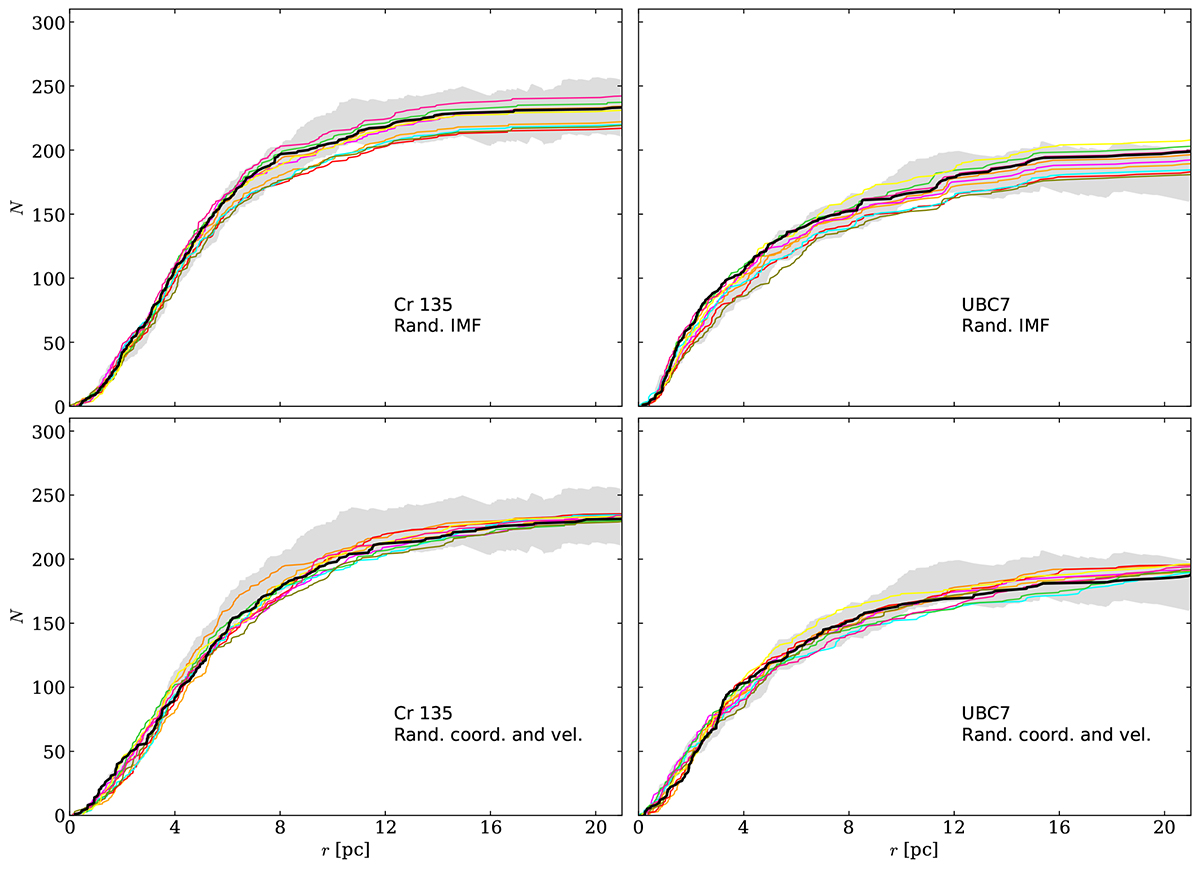
Cumulative number distribution of stars compared against the projected radius for Cr 135 (left panels) and for UBC 7 (right panels). The coloured lines represent different N-body randomisations. The upper panel presents the IMF sampling, and the bottom panels show the PV sampling. The shaded grey regions show the observational data with uncertainties.
Current usage metrics show cumulative count of Article Views (full-text article views including HTML views, PDF and ePub downloads, according to the available data) and Abstracts Views on Vision4Press platform.
Data correspond to usage on the plateform after 2015. The current usage metrics is available 48-96 hours after online publication and is updated daily on week days.
Initial download of the metrics may take a while.