Open Access
Fig. 3.
Download original image
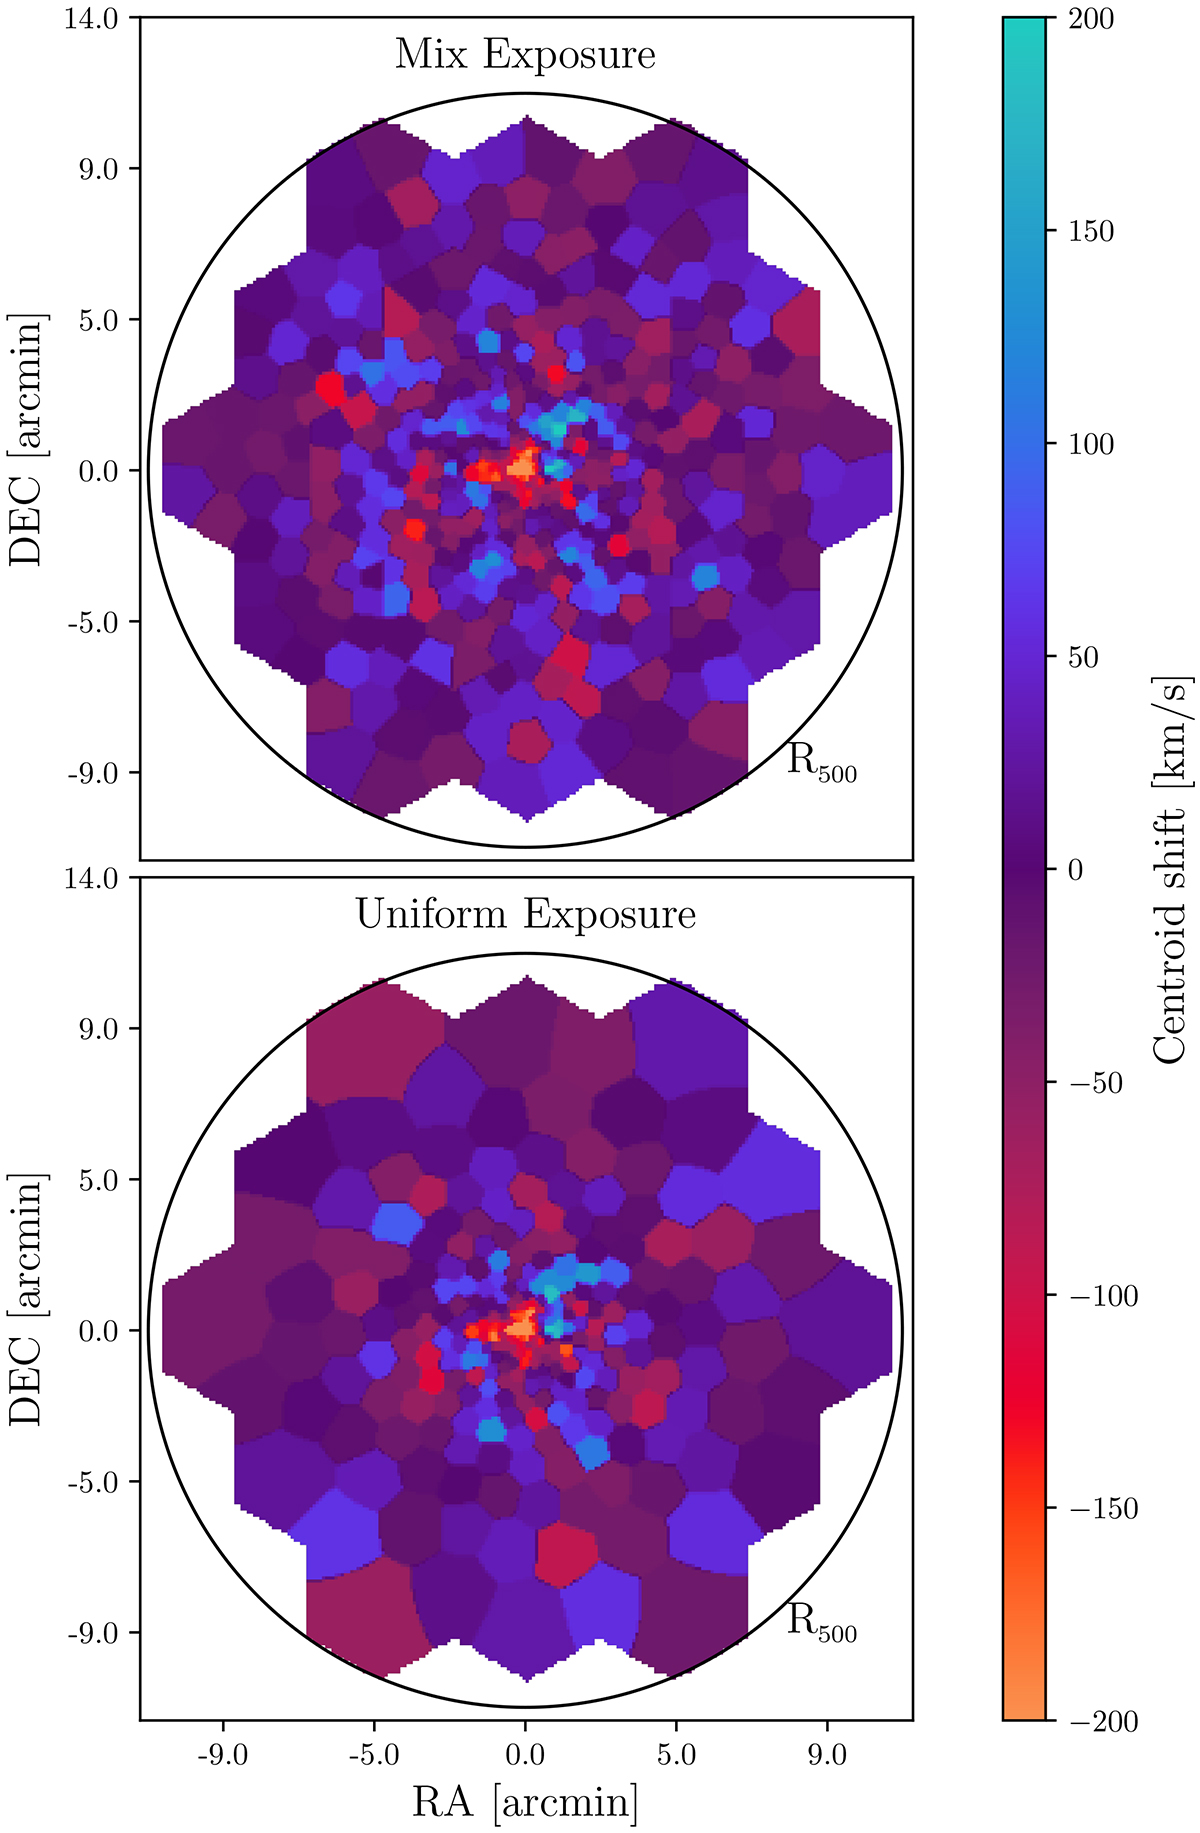
Output maps for mosaics with a mix exposure (top) versus constant exposure at 125 ks per pointing (bottom), for the centroid shifts. A black circle indicates the R500 radius. All the spatial bins were constructed such as to provide identical signal to noise levels in the resulting spectra.
Current usage metrics show cumulative count of Article Views (full-text article views including HTML views, PDF and ePub downloads, according to the available data) and Abstracts Views on Vision4Press platform.
Data correspond to usage on the plateform after 2015. The current usage metrics is available 48-96 hours after online publication and is updated daily on week days.
Initial download of the metrics may take a while.