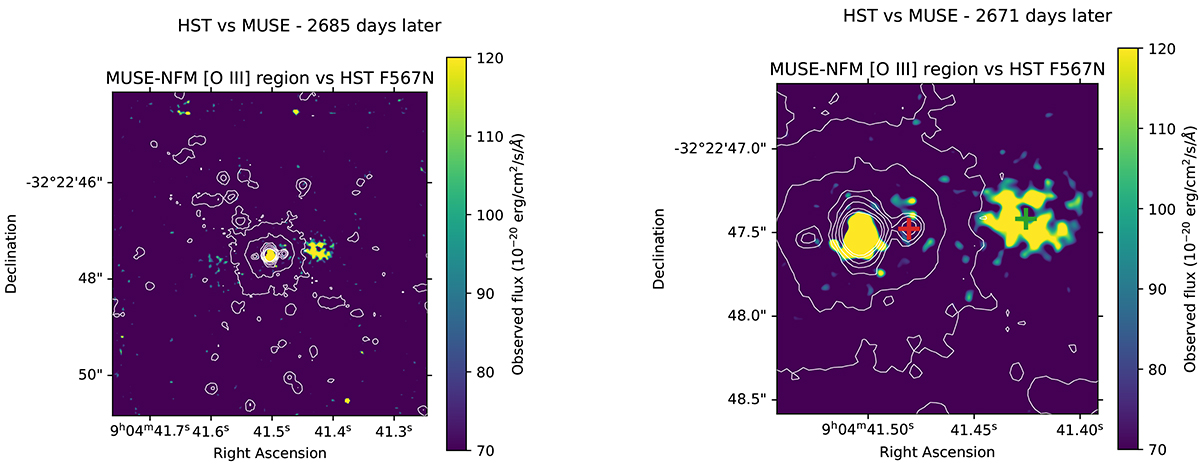
Fig. 6.
Download original image
The 2011 outburst ejecta observed with MUSE-NFM. Left panel: the [O III] gas distribution observed with the MUSE-NFM (7.5″ × 7.5″). White contours correspond to iso-surface brightness contours derived from the HST/WFC3 F657N image. Right panel: two 2″ × 2″ zoom-ins of the region covering the central WD and the bright pole ejecta. After registering the MUSE [O III] map for the HST astrometry, we measured a shift of 0.71 arcsec between the centroid positions of the ejecta observed in 2014 (with HST – green cross) and in 2021 (with MUSE – red cross).
Current usage metrics show cumulative count of Article Views (full-text article views including HTML views, PDF and ePub downloads, according to the available data) and Abstracts Views on Vision4Press platform.
Data correspond to usage on the plateform after 2015. The current usage metrics is available 48-96 hours after online publication and is updated daily on week days.
Initial download of the metrics may take a while.