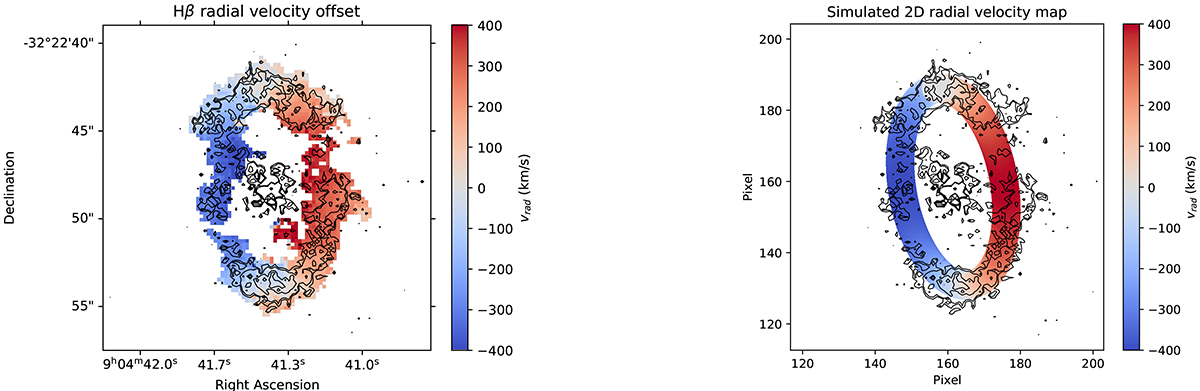
Fig. 4.
Download original image
Modeling the radial velocity of the T Pyx extended remnant. Left panel: Hβ radial velocity map obtained with the prescriptions given in the main text. The black curve represents the contour regions from the Hβ intensity flux map of Fig. 3. Right panel: simulated 2D radial velocity map of the ring remnant obtained from the best-fit parameters and the procedure delineated in the main text.
Current usage metrics show cumulative count of Article Views (full-text article views including HTML views, PDF and ePub downloads, according to the available data) and Abstracts Views on Vision4Press platform.
Data correspond to usage on the plateform after 2015. The current usage metrics is available 48-96 hours after online publication and is updated daily on week days.
Initial download of the metrics may take a while.