Fig. 3.
Download original image
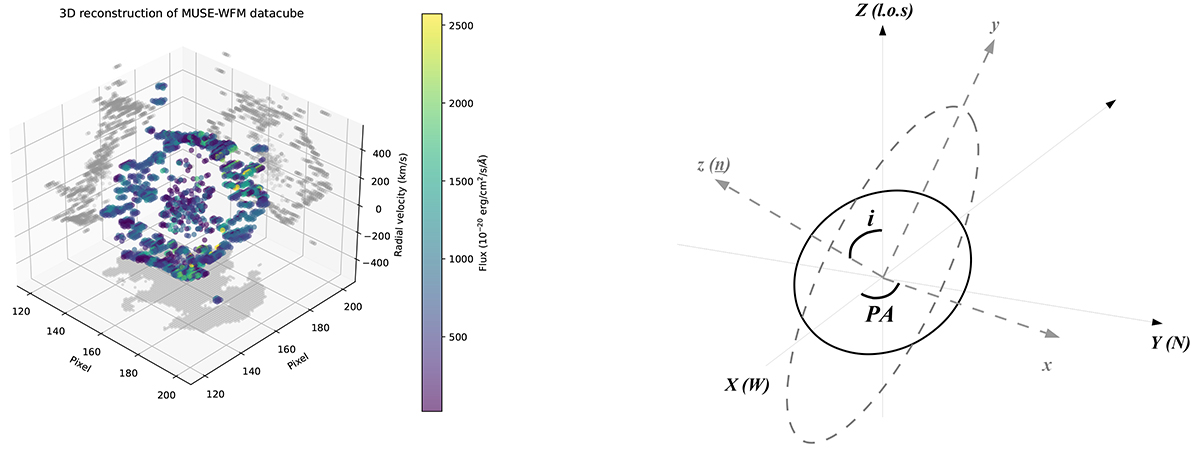
Modeling the spatial distribution of the T Pyx remnant. Left panel: three-dimensional reconstruction of the T Pyx remnant using the spatial resolution provided by the MUSE-WFM and using the radial velocity from the Hβ emission line as a proxy for the third dimension. The projection onto the corresponding 2D planes is shown with the gray data. Each single data point corresponds to a single bin resulting from the Voronoi tessellation algorithm described in Sect. 3. It is visible how the external remnant is arranged as a non-uniform thick ring, with inhomogeneities marked by the different flux intensities of the line (reported here with different colors). The line-of-sight direction is perpendicular to the X − Y (pixel–pixel) plane, and here it is shown as pointing to the top of the figure. Right panel: reference frame used to model the remnant of T Pyx and to recover the transformation equations described in Eq. (4), shown in black, with the observer’s line of sight located along the Z axis. The intrinsic remnant reference frame is reported with gray coordinates and a gray frame. The inclination (i) and position angle (PA) are also shown to help to reconstruct the projected model.
Current usage metrics show cumulative count of Article Views (full-text article views including HTML views, PDF and ePub downloads, according to the available data) and Abstracts Views on Vision4Press platform.
Data correspond to usage on the plateform after 2015. The current usage metrics is available 48-96 hours after online publication and is updated daily on week days.
Initial download of the metrics may take a while.