Fig. 1.
Download original image
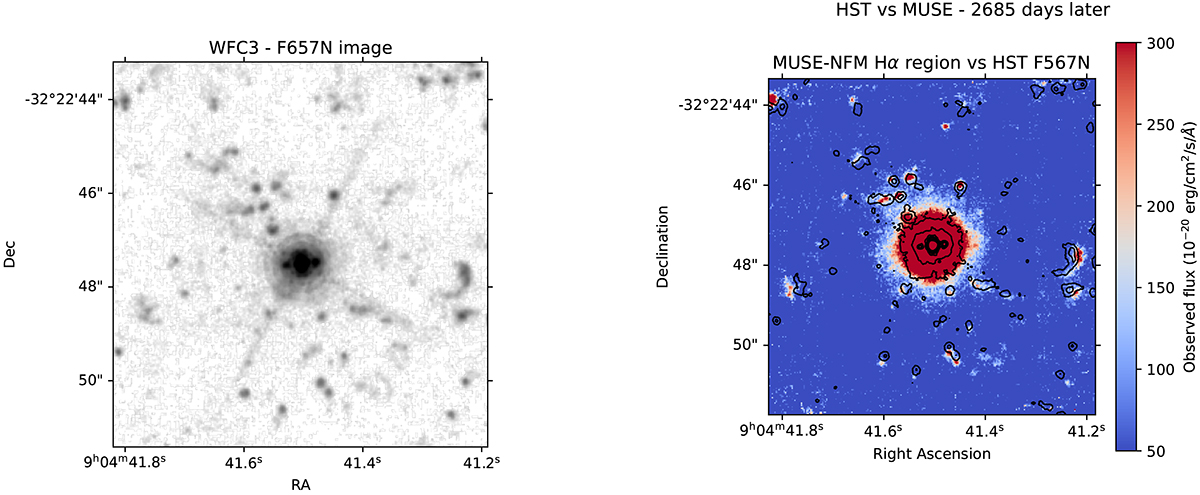
Left panel: HST/WFC3 image of the central region obtained three years after the last outburst and with the F657N filter centered at the Hα emission line. This region is the same size as the MUSE-NFM of the T Pyx remnant. Right panel: Hα flux map reconstructed from the MUSE-NFM datacube. The black curves correspond to iso-surface brightness contours derived from the HST/WFC3 F657N image. The image scale is the same, but MUSE data were obtained 7.35 years (2685 days) after the HST data. This is reflected by the clear shift for the majority of the Hα-[N II] knots visible in the image.
Current usage metrics show cumulative count of Article Views (full-text article views including HTML views, PDF and ePub downloads, according to the available data) and Abstracts Views on Vision4Press platform.
Data correspond to usage on the plateform after 2015. The current usage metrics is available 48-96 hours after online publication and is updated daily on week days.
Initial download of the metrics may take a while.