Fig. 9
Download original image
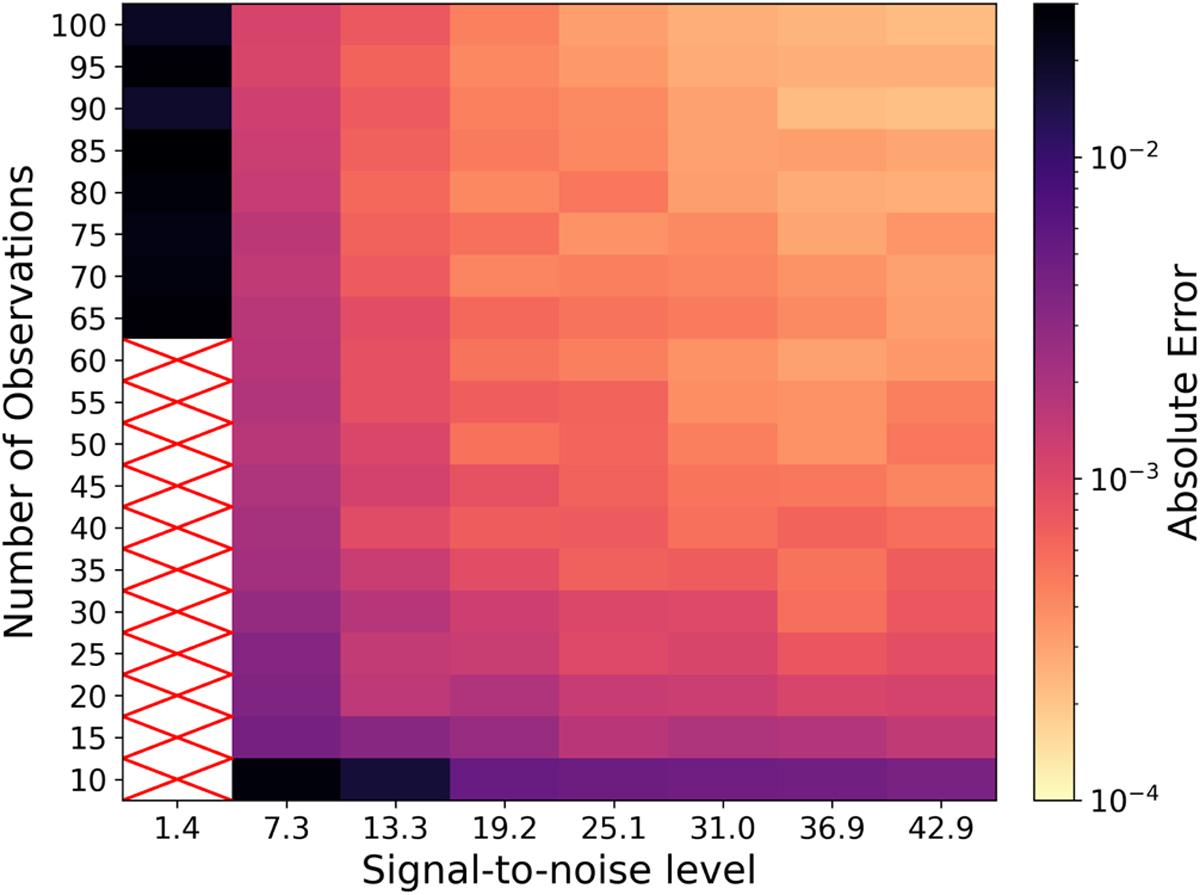
Heat map of the kernel regression sensitivity analysis, depicting the absolute error in frequency estimation as a function of sample size (y-axis) and amplitude (x-axis). Lighter shades correspond to lower absolute errors, with cells marked by a red cross representing an average absolute error above 0.03, deemed as unreliable estimates. The heat map suggests that approximately ten observations are sufficient for a reliable frequency estimate across various amplitude levels, with the only exception being the lowest amplitude level.
Current usage metrics show cumulative count of Article Views (full-text article views including HTML views, PDF and ePub downloads, according to the available data) and Abstracts Views on Vision4Press platform.
Data correspond to usage on the plateform after 2015. The current usage metrics is available 48-96 hours after online publication and is updated daily on week days.
Initial download of the metrics may take a while.