Fig. 8
Download original image
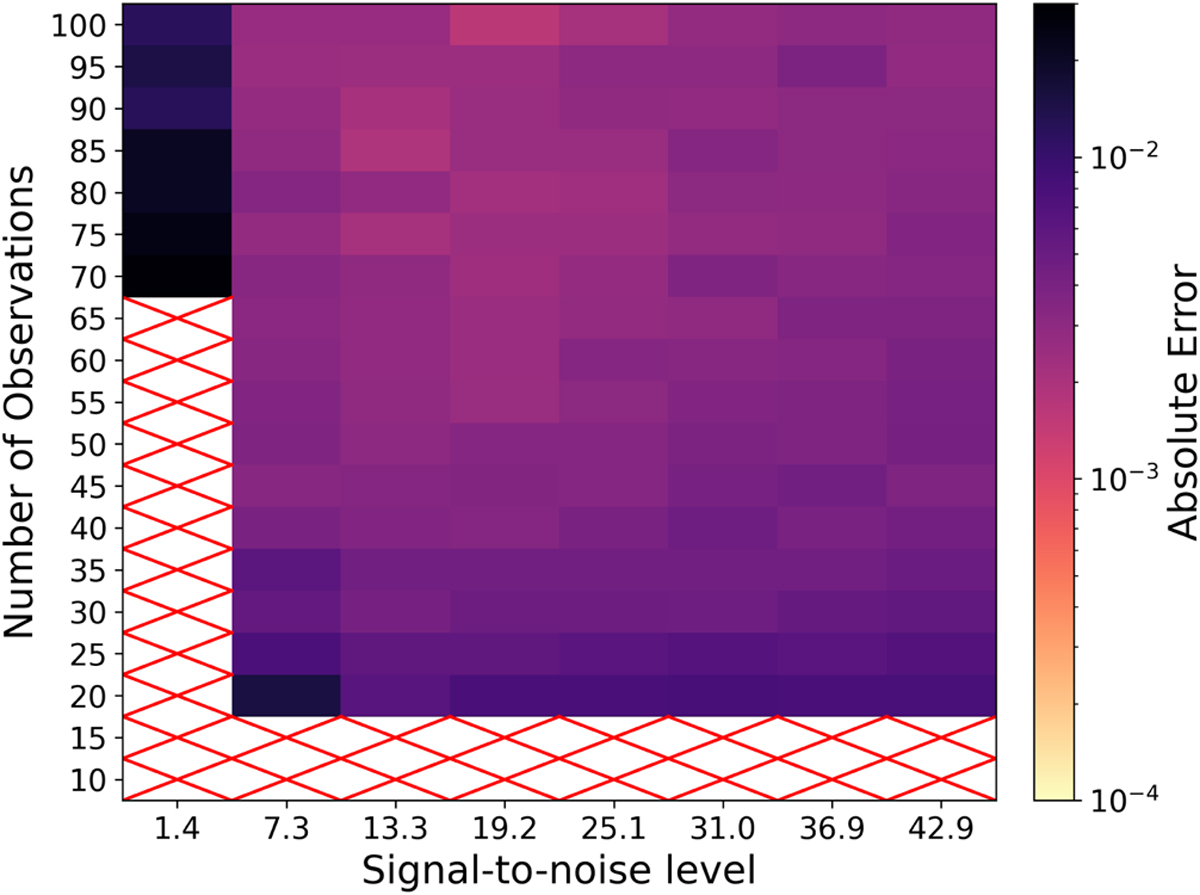
Heat map of the conditional entropy sensitivity analysis, illustrating the absolute error in frequency estimation relative to sample size (y-axis) and amplitude (x-axis). Lighter shades correspond to lower absolute errors, with cells marked by a red cross representing an average absolute error above 0.03, deemed as unreliable estimates. This analysis indicates that at least 20 observations are necessary for reliable frequency estimation at most amplitude levels, excluding the lowest one.
Current usage metrics show cumulative count of Article Views (full-text article views including HTML views, PDF and ePub downloads, according to the available data) and Abstracts Views on Vision4Press platform.
Data correspond to usage on the plateform after 2015. The current usage metrics is available 48-96 hours after online publication and is updated daily on week days.
Initial download of the metrics may take a while.