Fig. 7
Download original image
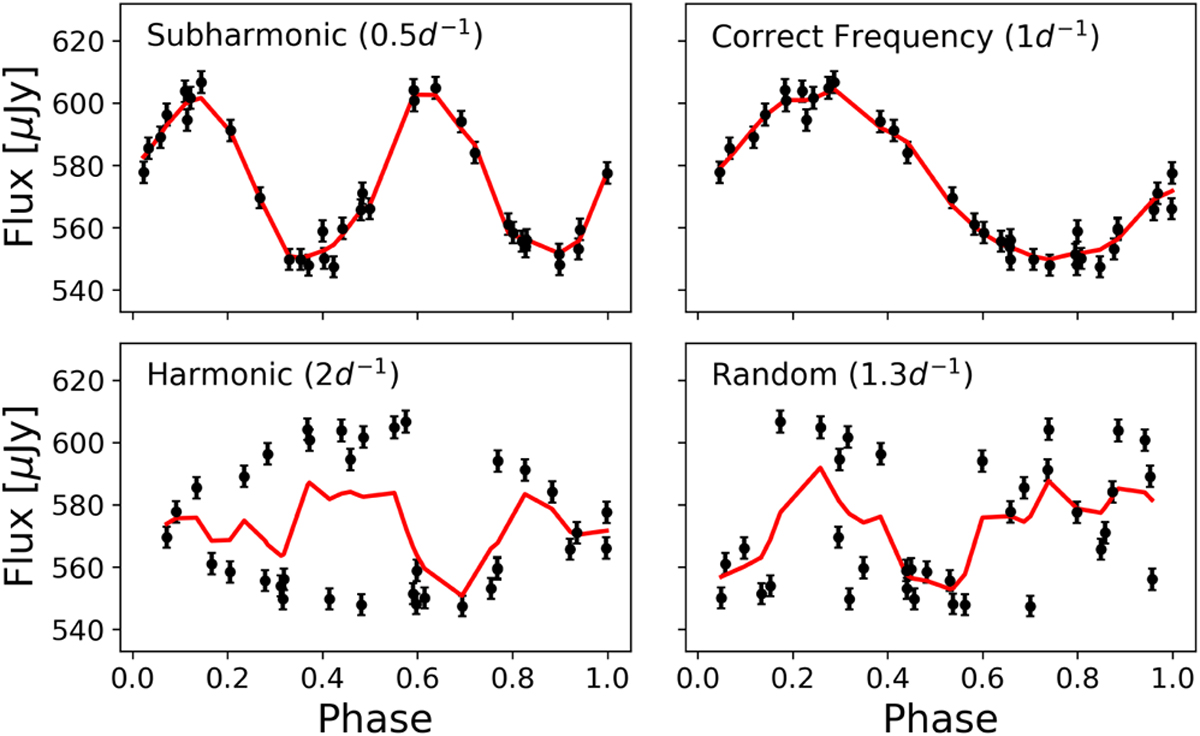
Kernel regression’s fits (red lines) for harmonics and sub-harmonics of the true frequency. The light curve is folded at four different frequencies: half the true frequency (top left), the true frequency (top right), twice the true frequency (bottom left), and a random frequency (bottom right). Conveniently, for multiples of the true frequency, kernel regression will badly fit the observations resulting in high residuals.
Current usage metrics show cumulative count of Article Views (full-text article views including HTML views, PDF and ePub downloads, according to the available data) and Abstracts Views on Vision4Press platform.
Data correspond to usage on the plateform after 2015. The current usage metrics is available 48-96 hours after online publication and is updated daily on week days.
Initial download of the metrics may take a while.