Fig. 5
Download original image
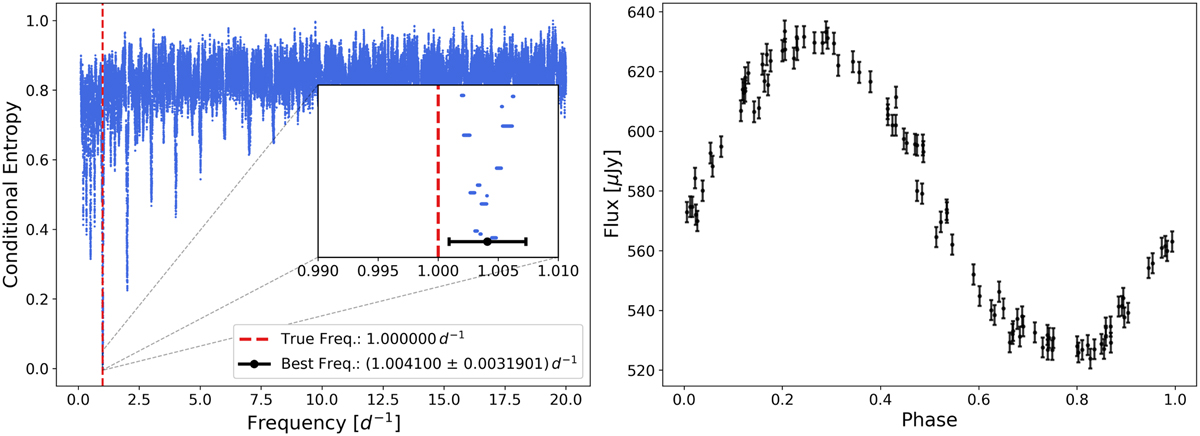
Conditional entropy’s results across a range of frequencies for a sinusoidal light curve with 100 observations, a baseline magnitude of 17, and an amplitude of 0.1 (S/N = 14.3). The plot on the left shows the frequency range searched, and the inset at the minimum entropy shows the noisy behaviour of the estimator. The estimated best frequency and its uncertainty are shown with a black error bar. The plot on the right shows the light curve folded at the found frequency.
Current usage metrics show cumulative count of Article Views (full-text article views including HTML views, PDF and ePub downloads, according to the available data) and Abstracts Views on Vision4Press platform.
Data correspond to usage on the plateform after 2015. The current usage metrics is available 48-96 hours after online publication and is updated daily on week days.
Initial download of the metrics may take a while.