Fig. 4
Download original image
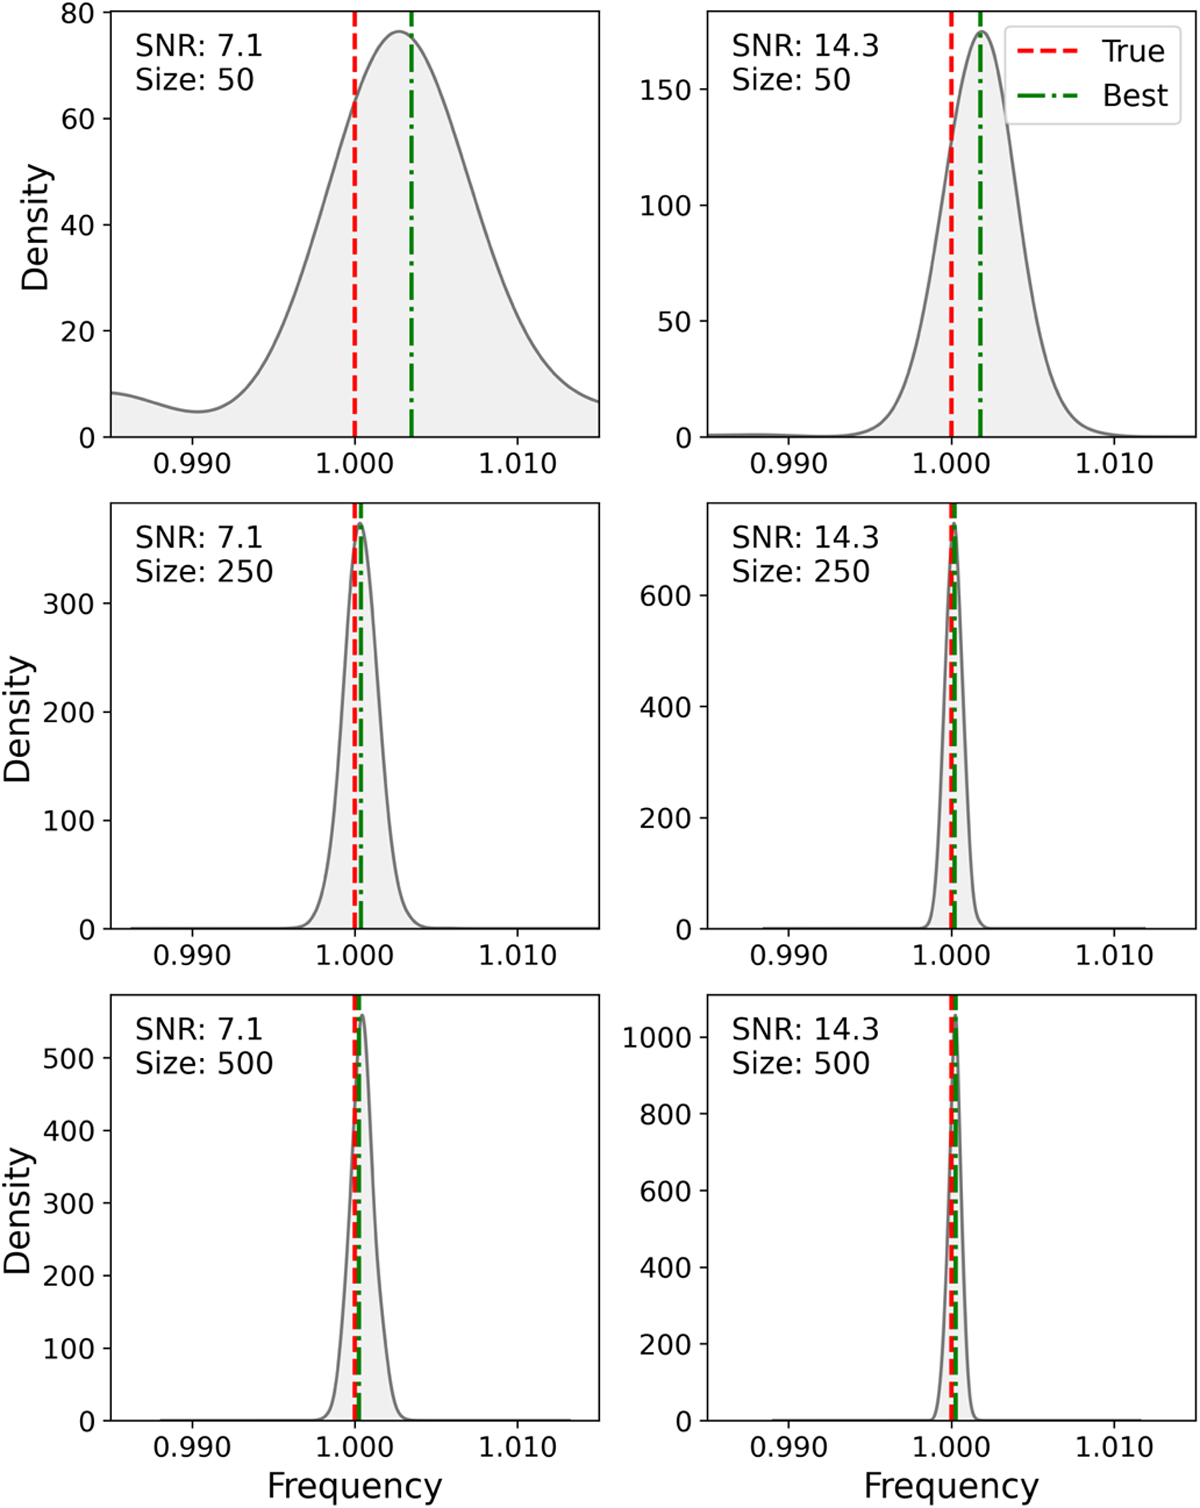
Kernel density estimations of bootstrap-estimated frequencies for a single synthetic light curve across varying sample sizes and S/N levels. Each subplot represents the bootstrap frequency distribution of the estimated best frequency juxtaposed with the true frequency of the synthetic light curve. As expected, with larger sample sizes and S/N, FINKER is more accurate, and its bootstrap density better resembles a Gaussian. Consequentially, the estimated frequency uncertainty is more reliable.
Current usage metrics show cumulative count of Article Views (full-text article views including HTML views, PDF and ePub downloads, according to the available data) and Abstracts Views on Vision4Press platform.
Data correspond to usage on the plateform after 2015. The current usage metrics is available 48-96 hours after online publication and is updated daily on week days.
Initial download of the metrics may take a while.