Fig. 14
Download original image
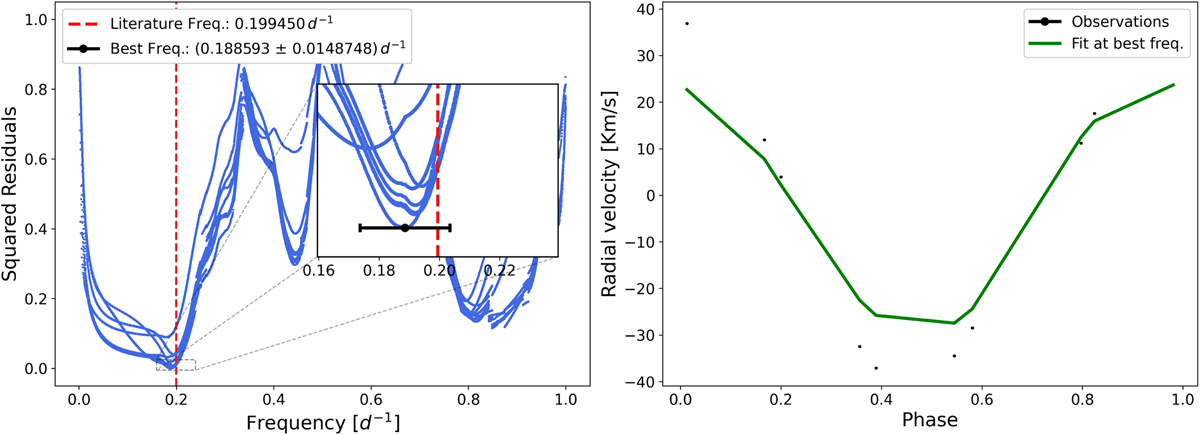
FINKER’s frequency search for V772 Cas with an adaptive bandwidth. The panel on the left shows the frequency range searched and the wild behaviour of the residuals due to the low number of points. The inset shows that the best frequency agrees with the literature values; however, the estimated uncertainty is unreliable due to the really low number of observations. The panel on the right shows the light curve folded at the found frequency with the kernel regression fit (green line) overlaid.
Current usage metrics show cumulative count of Article Views (full-text article views including HTML views, PDF and ePub downloads, according to the available data) and Abstracts Views on Vision4Press platform.
Data correspond to usage on the plateform after 2015. The current usage metrics is available 48-96 hours after online publication and is updated daily on week days.
Initial download of the metrics may take a while.