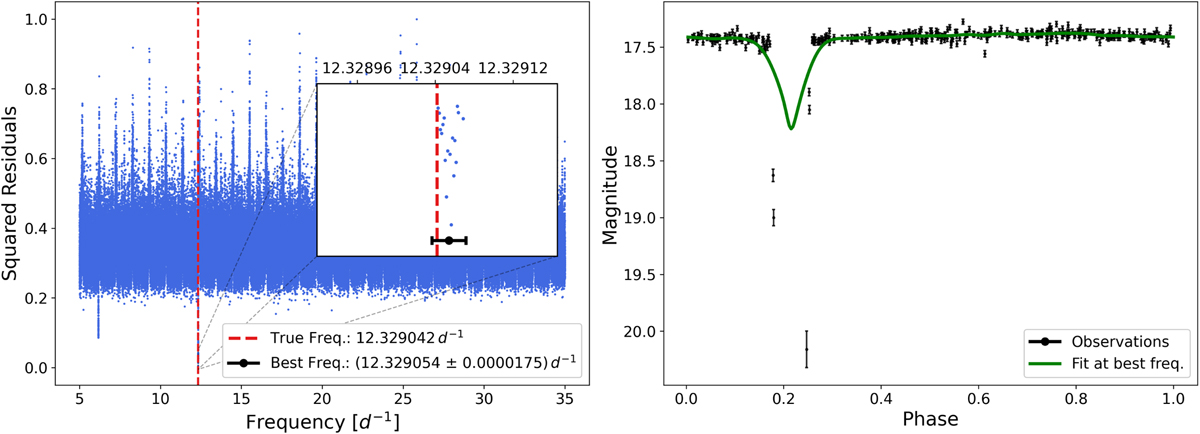
Fig. 12
Download original image
FINKER’s frequency search for ZTF J041016.82–083419.5. The panel on the left shows the frequency range searched, and the inset illustrates the behaviour of the residuals around the minimum. Transit data shows a less smooth behaviour of the residuals around the minimum, but the frequency and its uncertainty, shown as a black error bar, are consistent with the literature value. The panel on the right shows the light curve folded at the found frequency with the kernel regression fit (green line) overlaid.
Current usage metrics show cumulative count of Article Views (full-text article views including HTML views, PDF and ePub downloads, according to the available data) and Abstracts Views on Vision4Press platform.
Data correspond to usage on the plateform after 2015. The current usage metrics is available 48-96 hours after online publication and is updated daily on week days.
Initial download of the metrics may take a while.