Fig. 7.
Download original image
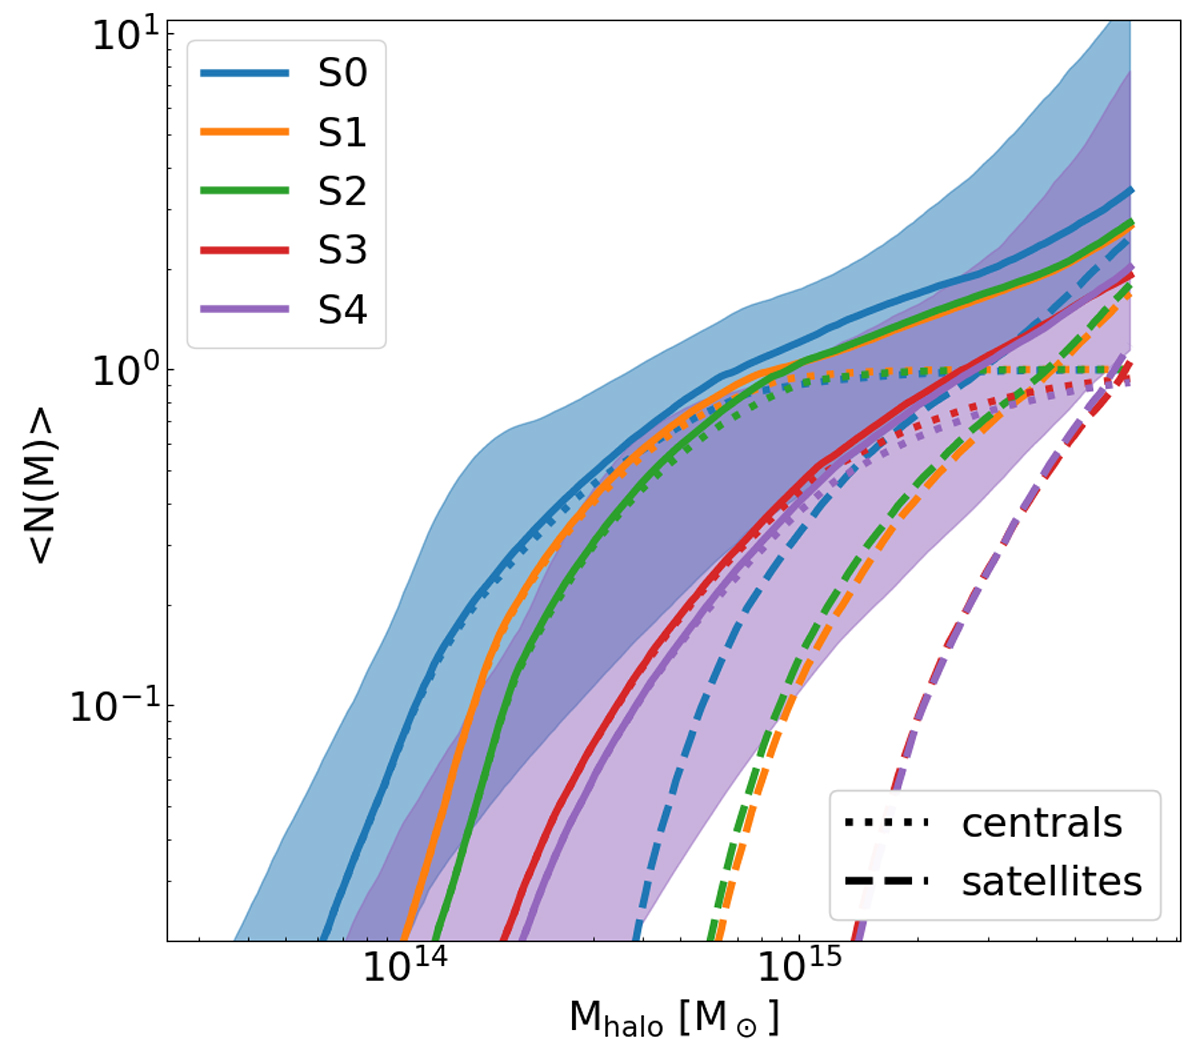
Derived distribution of the eRASS1 clusters and groups population in dark matter haloes (solid lines), divided in central (dashed) and satellite (dotted) objects. The colours denote each volume-limited sample (see Table 1). The shaded areas denote the 1-σ confidence levels on the model. For clarity, only the S0 and S4 samples are shown.
Current usage metrics show cumulative count of Article Views (full-text article views including HTML views, PDF and ePub downloads, according to the available data) and Abstracts Views on Vision4Press platform.
Data correspond to usage on the plateform after 2015. The current usage metrics is available 48-96 hours after online publication and is updated daily on week days.
Initial download of the metrics may take a while.