Fig. 5.
Download original image
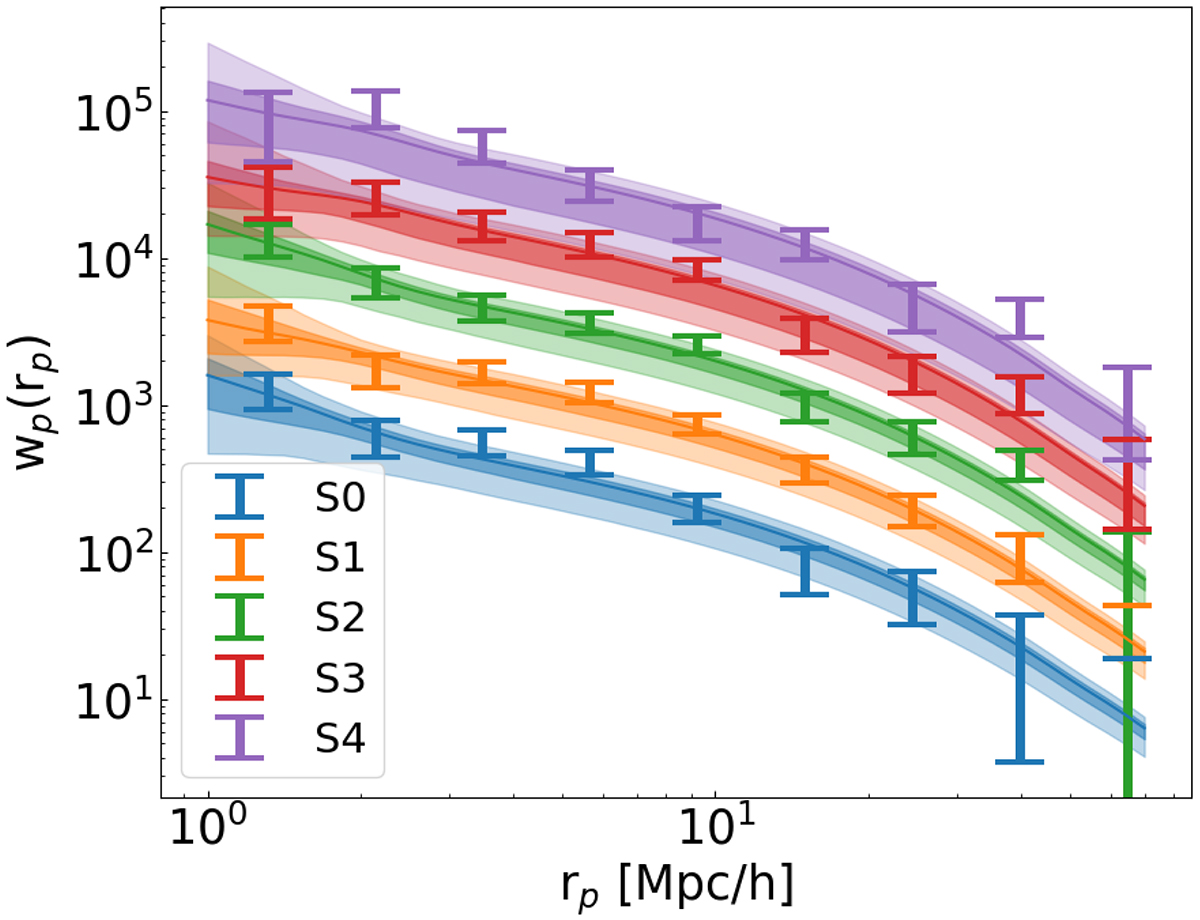
Projected correlation functions of the volume selected eRASS1 clusters samples. Each colour denotes one sample. The error bars show the measurement, the solid line is the best fit model, and the shaded areas denote the 1-σ and 2-σ uncertainty on the model. For clarity, we shift the measurements and models by e0, 1, 2, 3, 4 from S0 to S4.
Current usage metrics show cumulative count of Article Views (full-text article views including HTML views, PDF and ePub downloads, according to the available data) and Abstracts Views on Vision4Press platform.
Data correspond to usage on the plateform after 2015. The current usage metrics is available 48-96 hours after online publication and is updated daily on week days.
Initial download of the metrics may take a while.