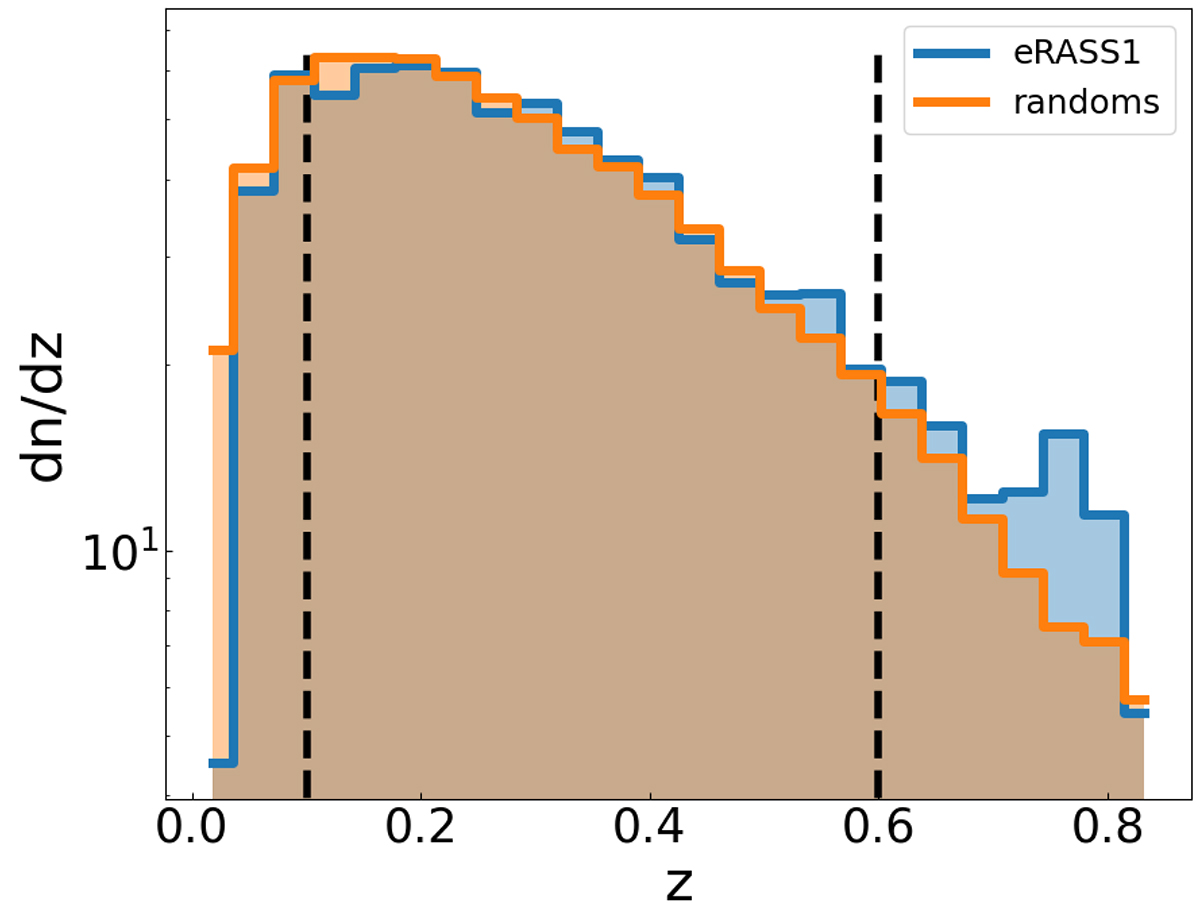
Fig. 3.
Download original image
Probability density redshift distribution of the selected eRASS:1 clusters and the random points. The panel shows the total number of clusters (randoms) in each redshift bin divided by the size of the bin in blue (orange), normalised by the integral over the redshift range. Two black vertical lines denote the redshift range used in our analysis, between 0.1 and 0.6. The bump in redshift at about 0.8 is due to a filter transition in the measurement of photo-z (see Kluge et al. 2024).
Current usage metrics show cumulative count of Article Views (full-text article views including HTML views, PDF and ePub downloads, according to the available data) and Abstracts Views on Vision4Press platform.
Data correspond to usage on the plateform after 2015. The current usage metrics is available 48-96 hours after online publication and is updated daily on week days.
Initial download of the metrics may take a while.