Open Access
Fig. 2.
Download original image
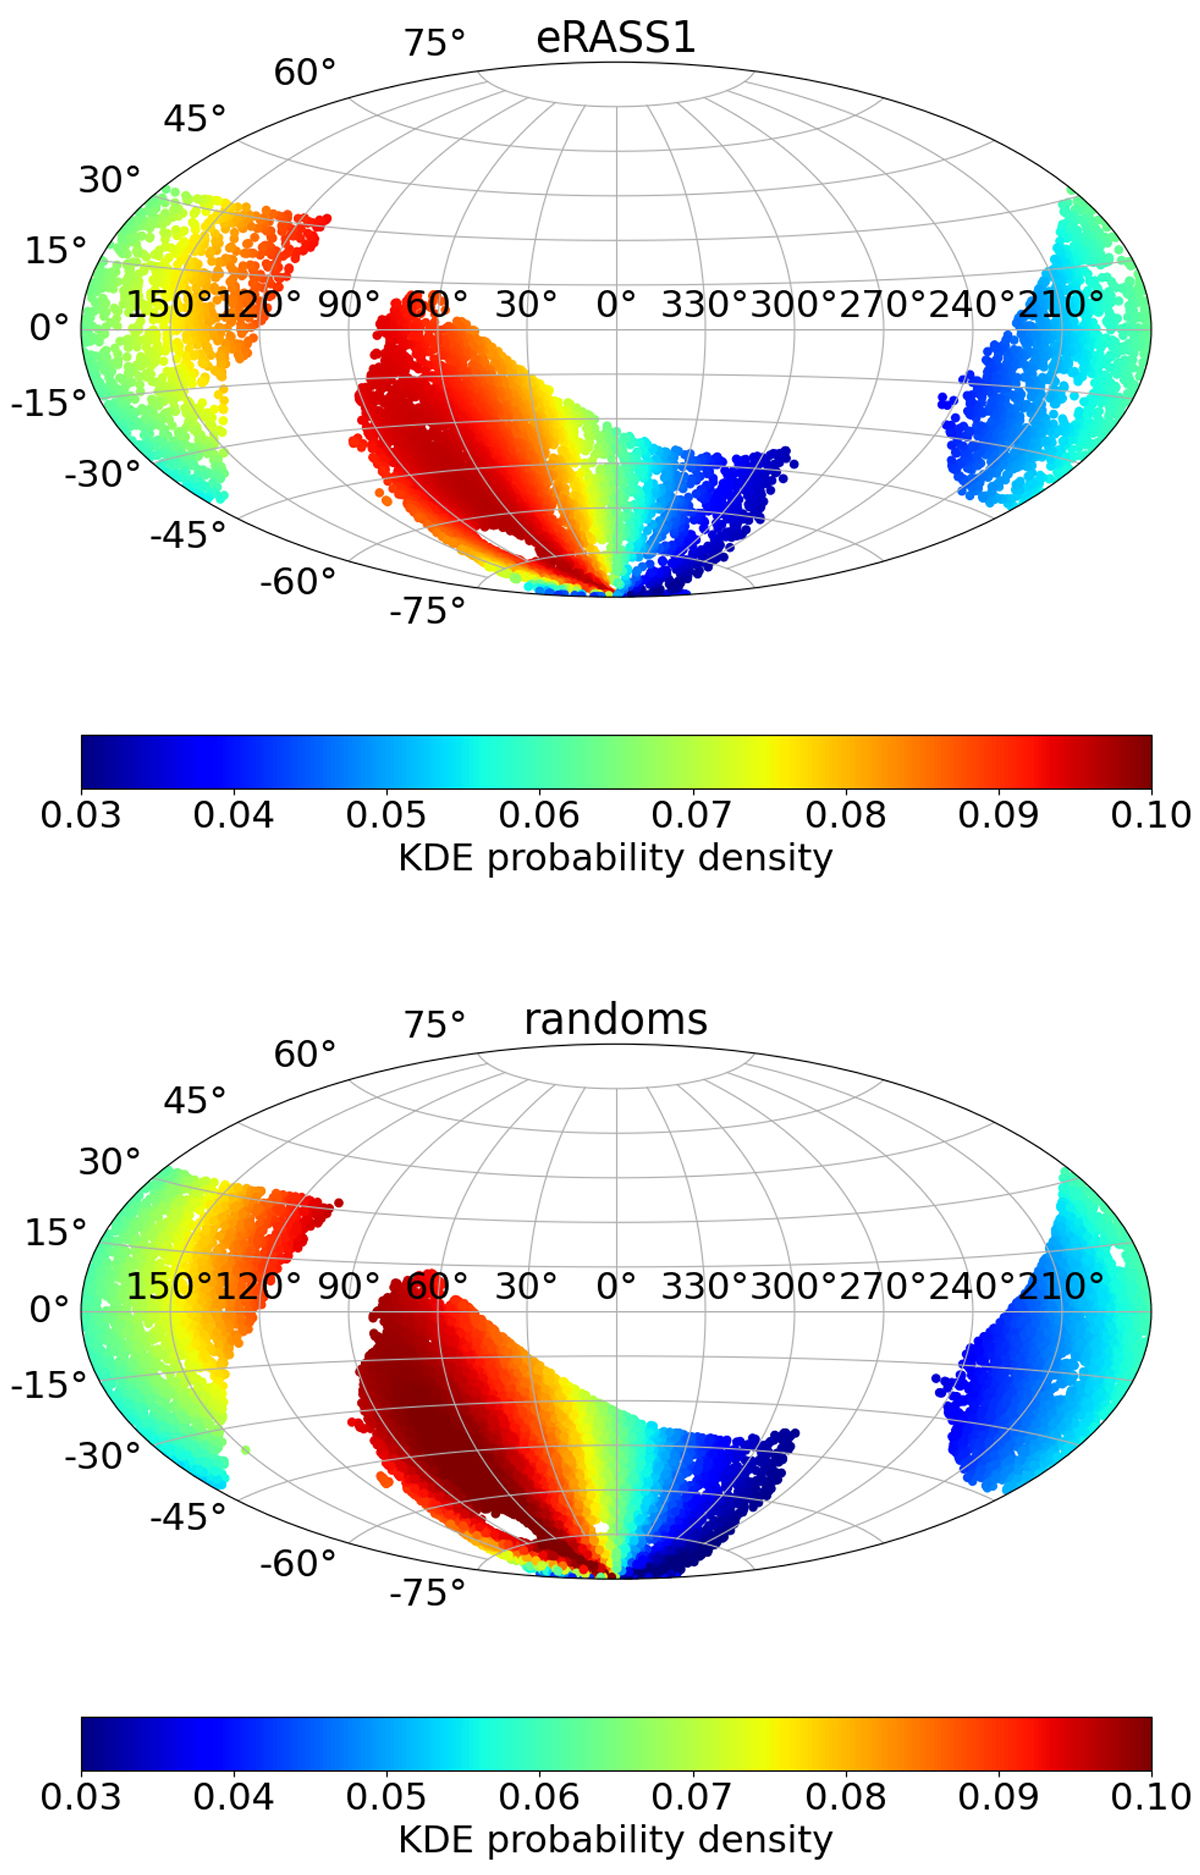
Angular distribution of the selected eRASS:1 clusters (top panel) and the random points (bottom panel), after the application of the masks. The points are colour-coded according to their normalised local density. The density of the random catalogue changes through the sky very similarly to the eRASS1 data.
Current usage metrics show cumulative count of Article Views (full-text article views including HTML views, PDF and ePub downloads, according to the available data) and Abstracts Views on Vision4Press platform.
Data correspond to usage on the plateform after 2015. The current usage metrics is available 48-96 hours after online publication and is updated daily on week days.
Initial download of the metrics may take a while.