Fig. B.3.
Download original image
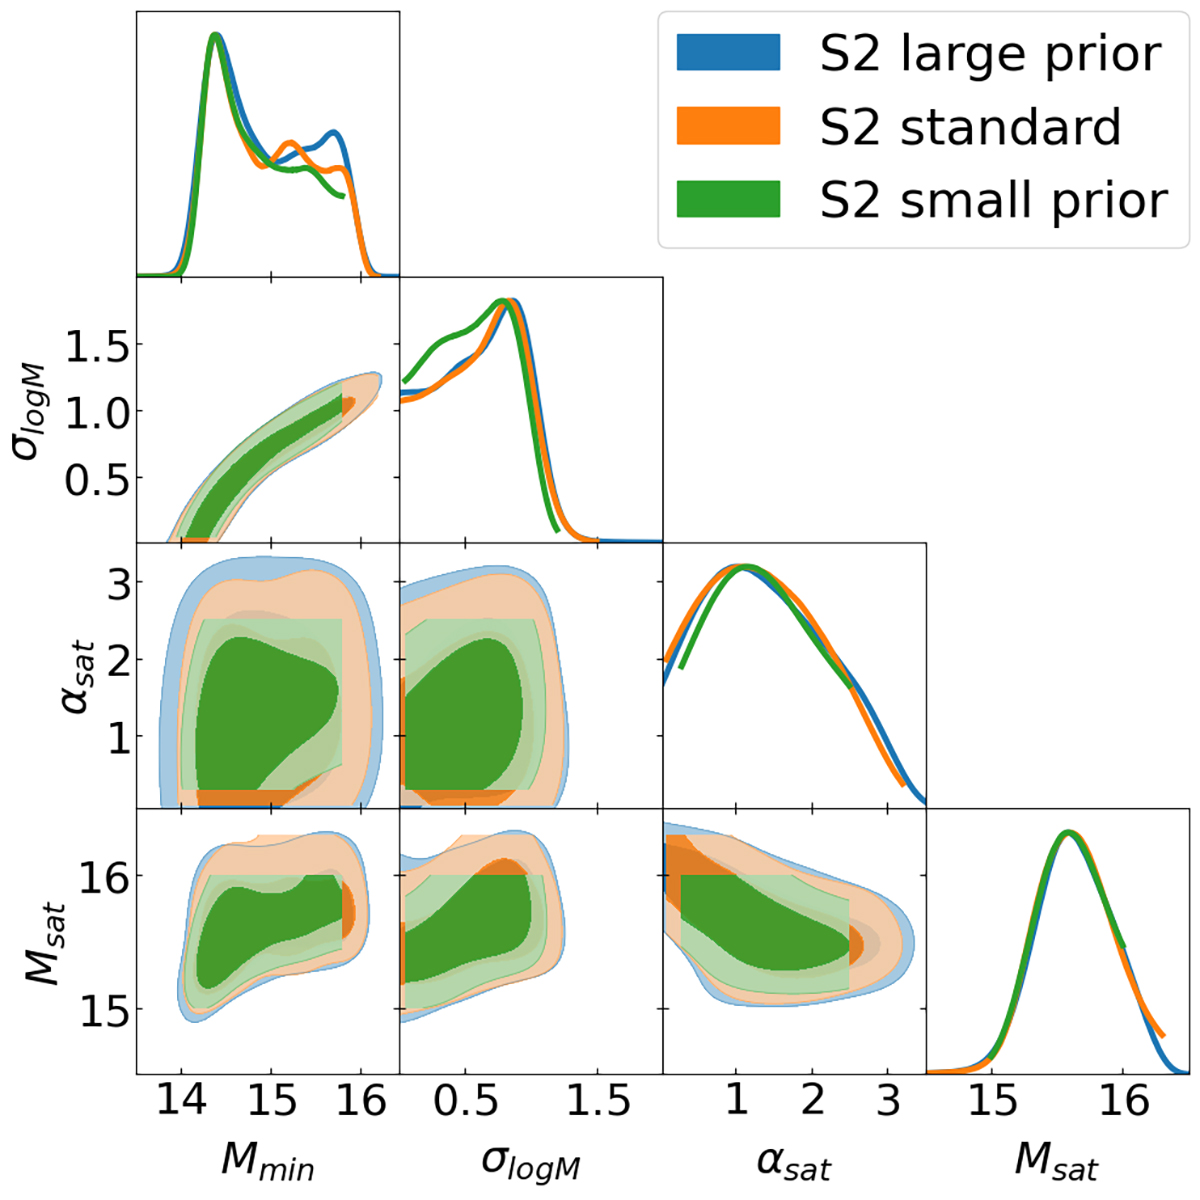
Marginalised posterior distributions of the best-fit HOD parameters on the S2 sample with different choices of the priors. The filled 2D contours show the 1-σ and 2-σ confidence levels of the posteriors after convolution with the uniform priors. The model is given by Eq. 8. The corresponding one-dimensional parameter constraints are reported in Table B.1. The blue (orange, green) shaded area denotes the large (standard, small) prior case.
Current usage metrics show cumulative count of Article Views (full-text article views including HTML views, PDF and ePub downloads, according to the available data) and Abstracts Views on Vision4Press platform.
Data correspond to usage on the plateform after 2015. The current usage metrics is available 48-96 hours after online publication and is updated daily on week days.
Initial download of the metrics may take a while.