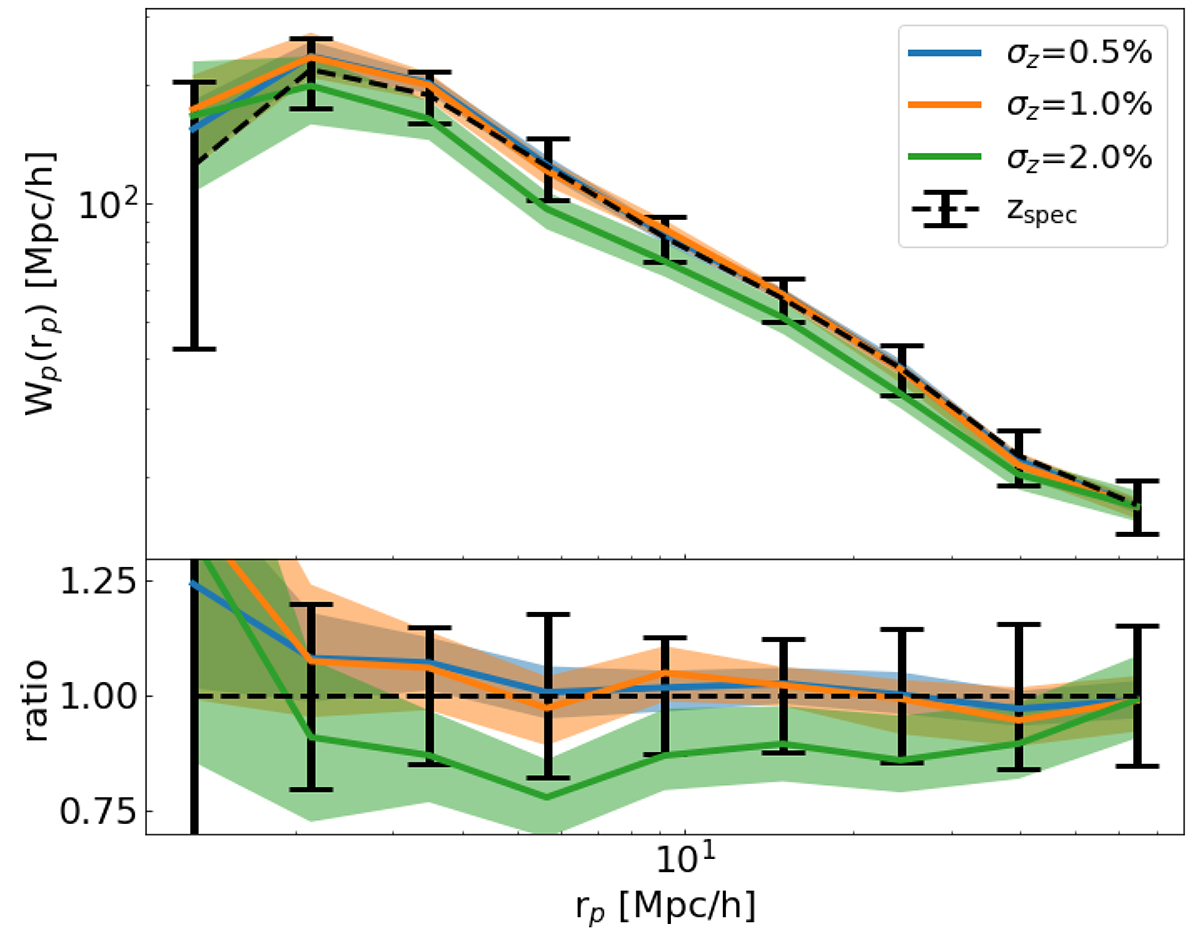
Fig. B.2.
Download original image
Projected correlation function measured on a flux-limited sample selected from the eRASS1 mock by Seppi et al. (2022), in the range 0.1 < z < 0.6, following the selection scheme explained in Sect. 3. The black points show the measurement using spectroscopic redshifts in the simulation. The blue, orange, and green lines denote three tests where the redshift was degraded to mock a photo-z, by adding a scatter of σz × (1 + z) around the spec-z. The bottom panel shows the ratio to the spectroscopic redshift case.
Current usage metrics show cumulative count of Article Views (full-text article views including HTML views, PDF and ePub downloads, according to the available data) and Abstracts Views on Vision4Press platform.
Data correspond to usage on the plateform after 2015. The current usage metrics is available 48-96 hours after online publication and is updated daily on week days.
Initial download of the metrics may take a while.